Smart Cell Culture Monitoring, Transform Single Cell Parameters into Cell Culture Intelligence
Introduction
Current cell culture monitoring typically involves manual sampling from each bioreactor being monitored, at least once per day, ideally more often. The sample is then prepared and cells are counted. An operator must then enter the results into a spreadsheet or other tracking software and generate a growth curve. After the growth curve is generated, an operator can then adjust culture controls accordingly. The challenge with this process is that it is highly manual, cumbersome and time consuming. Sampling an entire facility means a whole team is required to monitor what can be upwards of 50+ bioreactors. In addition, manual sampling creates an opportunity for contamination and variability. Sampling must also occur daily, which means that weekend work is required.
An Innovative Approach to Cell Culture Monitoring
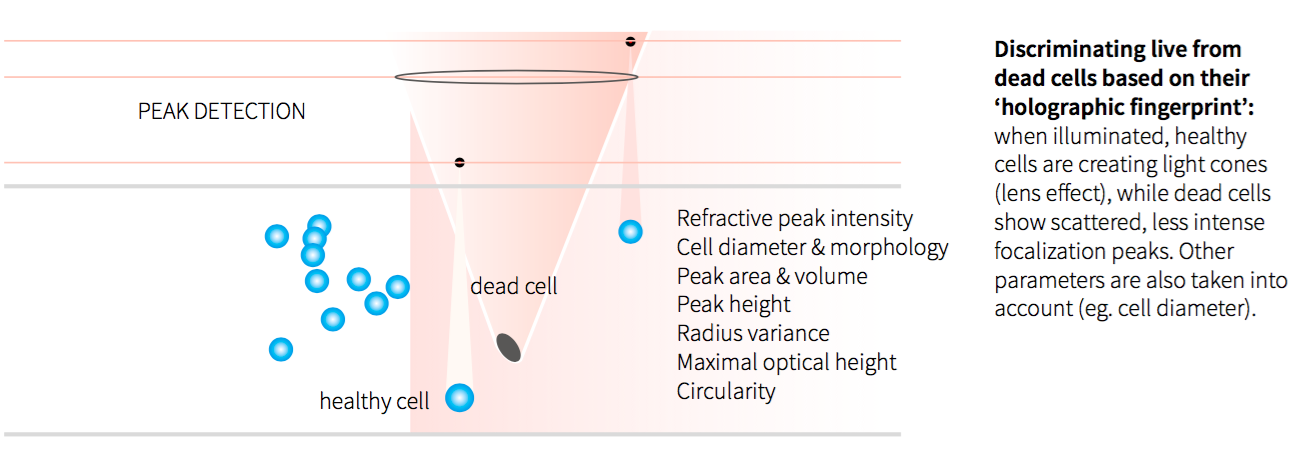
To enable a more automated and PAT (Process Analytical Technology) friendly approach to cell culture monitoring, Ovizio developed an innovative microscopy technology, the iLine F, that instead of taking a 2D image of a microscopic object, takes a hologram of a microscopic volume. Then for each microscopic object within the volume, it can compute a holographic fingerprint. This fingerprint. based on 59 parameters, can then be used to identify the cell type, whether it is alive or dead and other key parameters. Ovizio likens this holographic fingerprinting cell identification that uses machine learning to the mobile app Shazam’sTM ability to identify a song by just hearing a few seconds of it.
The iLine F employs differential digital holographic microscopy, a quantitative imaging technique that allows cell counting as well as cell viability monitoring in a continuous label free approach. This allows the iLine F to monitor cell growth inside the bioreactor on a single cell level, which permits tracking of cells, how they are performing against established parameters and to continuously document the process and thus enabling PAT implementation.
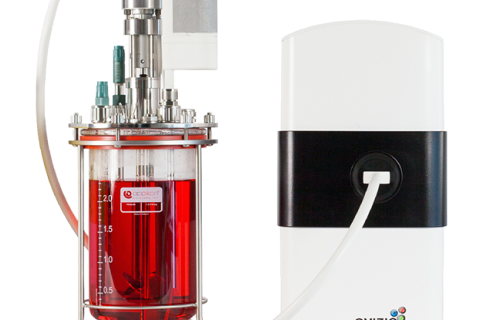
How iLine F Works
A submersible probe is inserted into the bioreactor/disposable bag. The probe is disposable, sterile, and autoclavable. The sample is then pumped out and it flows through a reading cartridge where the holographic fingerprint image is taken and a growth curve is graphed automatically. The sample is then returned to bioreactor, thereby completing the closed loop sampling process. This method also has the extra benefit of eliminating disposing of sample waste material as cells return to the bioreactor.
Figure 1: Viable Cell Counting Principle
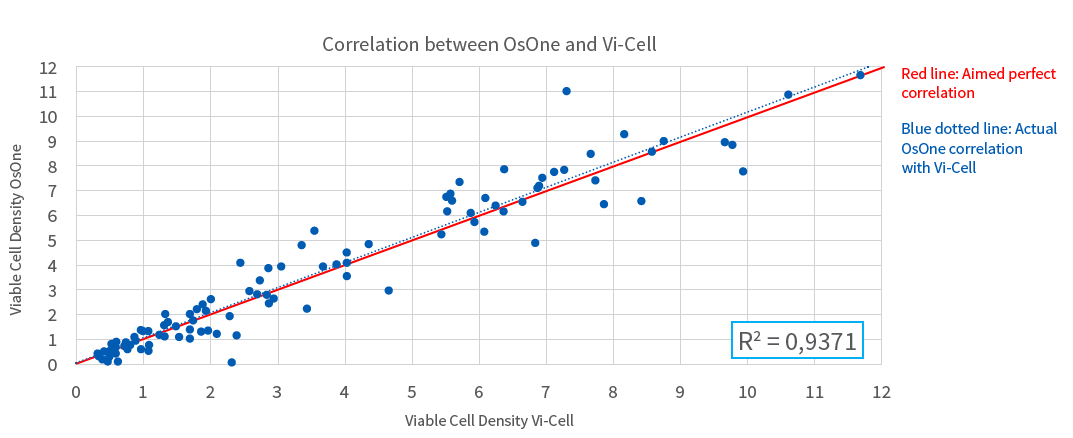
In a recent poster, “Continuous Suspension Cell Culture Monitoring in Bioreactors using Quantitative Imaging,” Ovizio describes the iLine F and its specialized OsOne software technology. In the poster they present a study in which they compared results generated by the iLine F with the reference method of applying automated Trypan-Blue exclusion staining combined with off line cell counting. The iLine F generated two cell counts per hour while the culture grew in batch mode for eight days. The results showed very good correlation (R2 = 0.94) of the cell density and cell viability compared to classic staining methods applying sampling and Trypan-Blue staining. Thereby demonstrating equivalence with extensively validated reference methods.
Figure 2: Correlation between Vi-Cell XR and iLine F for cell viability counting
Benefits of Continuous Cell Culture Monitoring
Operating cell culture monitoring continuously enables full automation and PAT implementation by identifying instantly any changes or issues with identified critical process parameters. An added benefit is that text messages or email alerts can be sent if something unusual appears in the sample. Information can also be accessed remotely and Ovizio can provide tools to integrate the automated feedback with manufacturing controls so that adjusting culture media and bioreactor conditions can be automated.
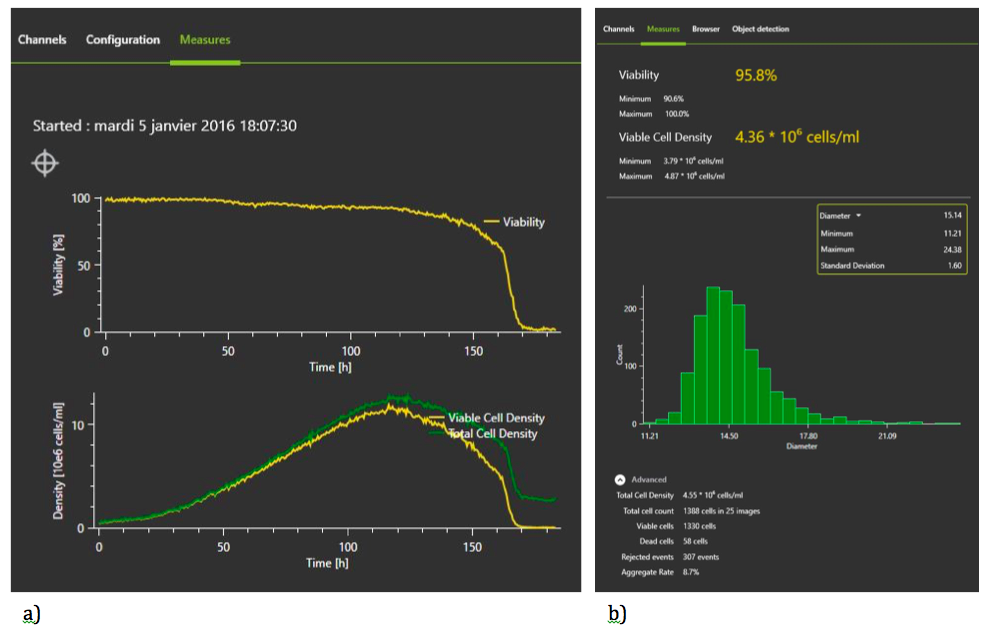
The specialized software, OsOne plots the cell growth curve and shows real time images of the cells, providing the additional benefit of visual inspection. In addition to cell density and viability, a total of 59 parameters are recorded.
Figure 3: Continuous Monitoring with the iLineF system
Advantages
In addition to the benefits of continuous monitoring described above, there are several other advantages highlighted in the poster, they include:
- No need for manual sampling thus reducing the risk of contamination
- Results are available in nearly real time, no staining required
- Full traceability at single cell level
- User independent, thus improving reproducibility
- Adds aggregate information as aggregates are not disrupted during sample preparation
By automating the cell culture monitoring process, manual sampling, data entry and graphing are all eliminated. This results in greatly reduced operational costs, a reduction in risk of contamination and a decrease in variability.
For more details of the study, please see: