
Automated Adenovirus Purity Analysis Speeds Viral-based Gene Therapy Process Development
<h5Abstract: MiniTEM™ is a low-voltage transmission electron microscope system designed for nanoparticle characterization. The high-quality images it acquires reveal particle morphologies that can be transformed into accurate metrics. A metric for sample purity based on the ratio of the total area of debris to that of intact Adenovirus particles is presented in this study. The automated analysis that MiniTEM offers encompasses a far larger number of particles compared with studies performed manually using conventional electron microscopy, resulting in accurate and statistically significant results.
Analysis time on MiniTEM in this study is approximately two hours, which saves about 65 hours compared with manual operation for the same number of images. The high-quality objective information obtained in this study can help speed up process and formulation development for viral-based Gene Therapy products.
Introduction
Adenovirus-based vectors are commonly-used gene delivery vehicles, especially in Gene Therapy applications where their efficient nuclear entry mechanism and low pathogenicity for humans are much-valued attributes. In addition, Adenovirus vectors can be produced in high titers and the particles are stable yet easy to modify.
Several methods of manufacturing Adenovirus-based products are in use today, including small-scale production in cell culture flasks, suspension-based scalable platforms and large-scale batch manufacturing in fixed-bed bioreactors. Downstream purification steps include chromatography and filtration, the objective of which is to produce high-quality, high-purity Adenovirus particles in a scalable manner. Methods for analyzing the purity and integrity of the Adenovirus particles in a time and cost-efficient way are therefore critical for this task.
Acquiring representative images of the samples and obtaining accurate purity data will help Adenovirus-based vector manufacturers assure the quality of their products. In this study, we use a protocol created from the MiniTEM analysis library to automatically screen, image and measure the size of Adenovirus particles and debris in two different samples.
MiniTEM system
MiniTEM is a 25-kV transmission electron microscope system specifically designed for nano-particle characterization. The system combines advanced Vironova software for microscope control, automation and analysis with Delong Instrument low-voltage technologies. This combination results in a compact system that runs in any laboratory setting and that does not require specialist skills to operate.
To perform sample characterization that includes both morphology and quantitative analysis, users configure a script using drag-and-drop building blocks in the system’s software. MiniTEM then automatically images, detects and classifies particles and debris according to the script. The system thus omits the time-consuming tasks associated with manual particle marking and measurements that often lead to inconsistent results due to subjectivity and human variability. Furthermore, since automation enables detection and analysis of a far larger number of particles than is feasible with manual operation, the results are more consistent, statistically significant and reproducible. MiniTEM analysis also has advantages over indirect methods such as Dynamic Light Scattering (DLS) and Nanoparticle Tracking Analysis (NTA), where polydispersity and viscosity of the sample may affect data clarity and complicate the interpretation of results.
Material and methods
Adenovirus samples
Kindly provided by FKD Therapies Oy.
Sample preparation
The two samples were prepared using the sitting-drop procedure and negatively stained accordingly. In brief, three microliters of sample were applied on glow-discharged, carbon-coated 400 mesh copper grids and incubated for approximately 30 s. Excess sample was blotted off and the grid was washed with water and stained using 2 % uranyl acetate for 10 s. Finally, the stain was blotted off and the grid was left at room temperature to air dry.
Results
Manual imaging and analysis
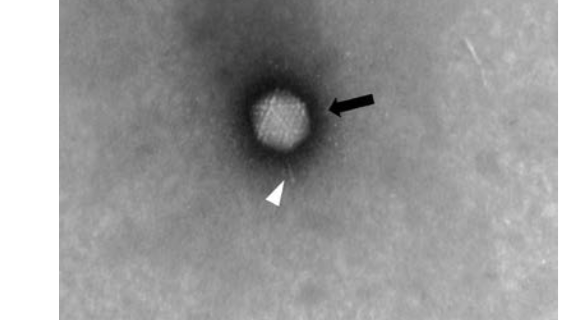
Images acquired manually with MiniTEM are of high quality (Figure 1). High-magnification images obtained show Adenovirus as bright, intact icosahedral-shaped particles (black arrow) with fiber structures protruding from the vertices (white arrowhead). In the background, free fiber structures (white arrowhead) as well as small ring-like structures (black arrowhead) can be observed. Small assemblies or clusters of free fiber and ring structures are classified as debris and are more abundant in Sample 2.
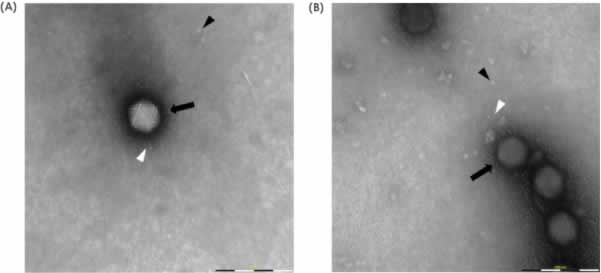
structure protruding from the vertices (white arrowhead) and a low amount of debris. B) Sample 2 shows Adenovirus particles and also abundant free fiber structures (white arrowhead) and small ring-like structures classified as debris (black arrowhead).
Automated image acquisition and analysis
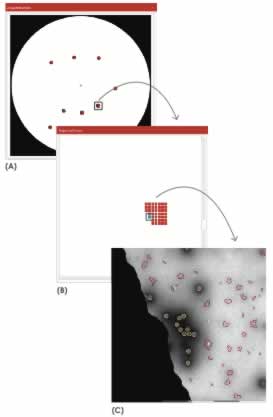
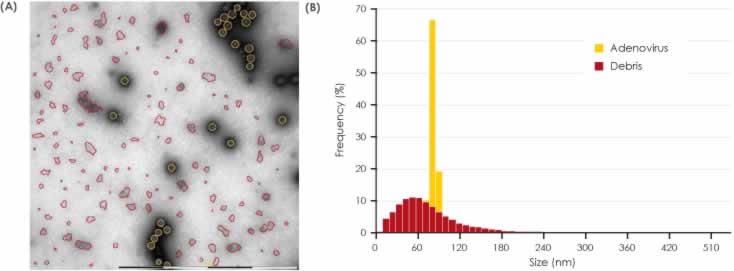
Areas of interest on the grid were manually selected. A script created from the MiniTEM analysis library was then employed that automatically acquired images in the selected areas and then detected and classified particles in the images. This automation made it possible to objectively analyze large areas at multiple locations of the grid in a short time. Particles were classified according to their specific morphological attributes. Those detected as having a morphology deviating from that of an Adenovirus particle were automatically classified as debris. Figure 2 illustrates the sequence of the analysis events.
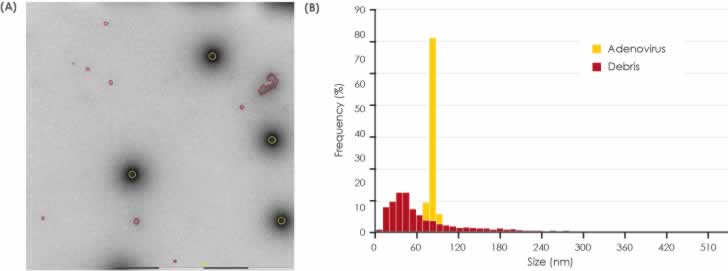
Once particles in the images had been classified as either Adenovirus particles or debris, their sizes were measured. In the 270 images acquired for Sample 1, 5604 particles were detected. For Sample 2, 234 images were acquired and 27,445 particles detected. The difference in the number of detected particles is explained by the larger amount of debris found in Sample 2.
Figures 3 and 4 show the detection and classification results for Samples 1 and 2 respectively. The size distribution plots show the narrower Adenovirus particle size as well as the broader size distribution of the debris. In both samples, the detected Adenovirus particles are of expected size and the size distribution profile of the debris is of approximately the same range in the two samples. It is clear, however, visual inspection of the MiniTEM images clearly shows that Sample 1 contains less debris than Sample 2.
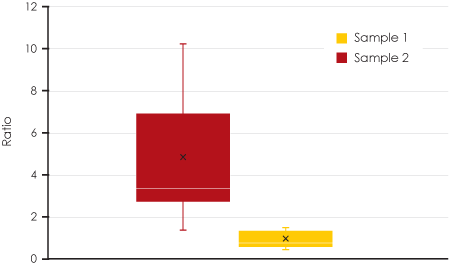
To provide a metric for purity, the ratio of the total area of the debris to that of the Adenovirus particles was calculated. The box-plot shown in Figure 5 illustrates how this metric is applied to compare the purity of the two samples. In Sample 1 (yellow box), the ratio is low since the total area of the debris is low. In Sample 2 (red box), the ratio is higher due to the larger total area of debris. Each data point in the plot corresponds to the purity measurement for all images at a specific area of interest.
Time to results
The automated image acquisition, particle detection and classification offered by MiniTEM enable analyses that would be unfeasible using conventional electron microscopy. In this study, 270 images were acquired for Sample 1, wherein 5604 particles were detected. For Sample 2, 234 images were acquired and 27,445 particles detected.
Since classifying the Adenovirus and debris particles means analyzing all images, performing this investigation manually using conventional EM would require massive time and effort from the analyst, which could easily result in human error and biased results. In contrast, MiniTEM performs this task with much greater speed, objectivity and consistency.
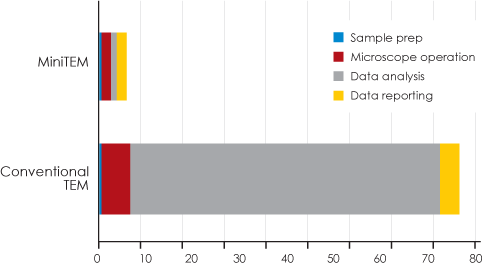
Figure 6 clearly illustrates the time-savings won by using MiniTEM. The biggest gain occur during data analysis, where MiniTEM achieves an accurate and reliable result in approximately two hours compared to approximately 65 hours for manual image analysis and measurement.*
* Manual imaging on conventional EM was not performed in its entirety for practical reasons. To compare the time required to obtain data of similar accuracy using manual handling, the time for data analysis of 20 images was extrapolated to estimate the time needed for 504 images.
Conclusions
The high-quality images obtained with MiniTEM clearly reveal differences in the amount of debris between the two Adenovirus particle samples. Furthermore, the calculated ratio of the accumulated area of debris and intact Adenovirus particles in the individual samples presents a reliable metric value of sample purity. This combination of visual proof and metric values is not achievable from indirect methods like dynamic light scattering, nor is it feasible with conventional EM due to the very long hours of manual work required. With MiniTEM, therefore, process operators can rapidly and reliably compare samples from different purification steps and gain valuable insights into the stability of different product formulations, information that is critical for taking correct decisions when developing Gene Therapy products.
For more information, please see www.Vironova.com/minitem
For more information, please see the Cell Culture Dish articles:
- Direct vs. indirect methods for characterization and analysis of subvisible particles – A comparative study
- Automated integrity analysis of AAV and Adenovirus particles using MiniTEM
- See the Quality of your Viral Particles at Different Steps of your Process