

Evolution of Viral Vector Analytics for Gene Therapy Manufacturing

“Insights on Successful Gene Therapy Manufacturing and Commercialization”.
You can download all the articles in the series, by downloading the eBook.
With over 350 cell and gene therapies in clinical trials in the US and more than 700 globally, the explosive growth in the field is only expected to increase in the years to come.1,2 This rapid progress from clinical development towards product licensure has resulted in a viral vector supply bottleneck. The challenge in viral vector-manufacturing capacity is estimated to be 1–2 orders of magnitude lower than what is needed to support current and future commercial supply requirements.3 Concomitantly, regulatory scrutiny and product characterization requirements are increasing, as more gene therapy products reach commercialization.
To meet these demands, viral vector manufacturing processes will need to evolve to become more sophisticated and so too will the analytical tools needed to evaluate them. Continued improvements and adoption of rapid, robust technologies for viral vector analytics/characterization and rigorous quality control assays will be essential to facilitate the timely development of the gene therapies that require them.2
Speed to market is perhaps one of the most crucial aspects in the cell and gene therapy segment due to their potential as curative therapies. Many of these therapies qualify for orphan drug status and/or fast track designation status, significantly shortening the drug development timeline from 7 to 10 years (for traditional biologics) to 3 to 5 years putting even more pressure on manufacturers to decrease production timelines.4 For viral vector developers, the analytical methods required to keep up with these accelerated timelines will need to overcome the limitations of lab-based, classical technologies for product characterization and quality testing to facilitate in-process optimization efforts.
Here, we spoke with industry experts to get their insight on how the landscape of analytical tools has evolved over the past few years as the implementation of process analytical technology (PAT) by viral vector manufacturers has become more commonplace. Analytical processes have matured and become more refined, but there is still much more that can be improved. It is critical to evaluate as an industry how best to move forward to fill any existing knowledge gaps, whether it is learning from other, more mature bioproduction systems or investing in novel, innovative technologies.

Current Challenges with Viral Vector Analytics
As more gene therapy products are approved and the technologies to produce them become more established, increased regulatory expectations for greater sensitivity, specificity and accuracy are exceeding the limits of existing analytical technologies. There is a need to shift away from lab-scale, “tried and true” techniques that are slow, low throughput, and often highly variability with poor reproducibility and precision. These methods should be replaced with assays that are more robust, rapid and accurate.
The focus of PAT within the Quality by Design (QbD) framework has driven an investment in high quality analytics that can generate closer to “real-time” data that can inform process development decisions to achieve higher yields and improve viral vector safety profiles. The lag time between sampling and results from traditional assays can sometimes be days to weeks, which is prohibitive to effective design of experiment (DOE). Additionally, these assays may lack the resolution needed to show subtle changes that may result from stepwise process optimization. While incorporating novel analytical tools is a key goal for viral vector production, it is recognized that these methods require validation before they are acceptable for use in clinical manufacture by regulatory agencies. Therefore, their usage in research and process development is critical not only to enable iterations to improve the manufacturing process, but also to validate that these methods can satisfy regulatory demands. Key to this will be the usage of parallel orthogonal methods with appropriate controls to ensure the integrity of the data.
Evolution of Viral Vector Analytical Assays
In January of 2020, the FDA published revised regulatory guidelines for cell and gene therapy. In case of viral vector analytics, changes were made for analytical procedures specific to impurities, replication, titer, infectivity.5 Overall, the FDA requires more detailed information/characterization and FDA regulatory documentation for these parameters, which is only expected to increase as the field matures and development continues.
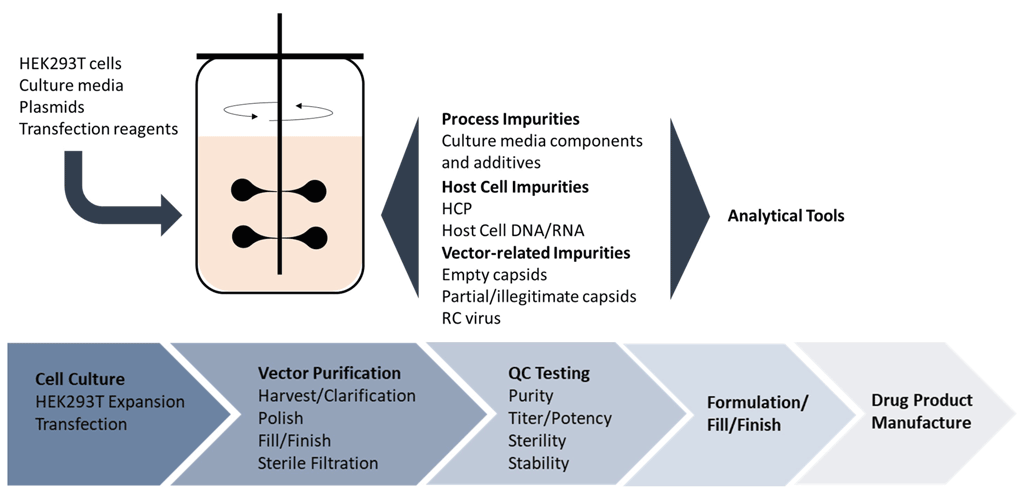
The analytical tools to characterize viral vectors continue to evolve as the needs of the industry change, but the five main quality pillars reflected in the current regulatory guidance have not. The critical quality attributes (CQA) as mandated by the FDA’s chemistry, manufacturing and control (CMC) guidelines for viral vector manufacturing include: identity, strength/potency, purity, safety and stability. These controls help to quantify the product heterogeneity observed with viral vectors to ensure safety and efficacy, which is especially important for cell-based gene therapies (Figure 1).
It’s clear that expertise in a wide variety of analytical techniques is necessary to detect and characterize biopharmaceuticals and their impurities (both product- and process-related impurities). In many cases, viral vector manufacturers can leverage technologies that have proven their effectiveness in the production monoclonal antibodies (mAbs), some of which will be discussed here. However, for most of these newer, more complex molecules, customized assays must be developed, keeping in mind their speed, accuracy and robustness.4
| Quality | Attribute | Example Assays | Next Generation Assays |
|---|---|---|---|
| Identity | Genetic identity | Genome sequencing (NGS) PCR | |
| Protein identity | SDS-PAGE | CE-SDS | |
| Mass spectrometry (MS) | |||
| Western blot (immunoblot) | Automated Western blot | ||
| Strength/Potency | Physical viral titer | ELISA | MADLS |
| qPCR | ddPCR | ||
| Optical density (A260/280) | |||
| NanoSight | |||
| HPLC (AAV packaging ratio) | CE-SDS or CE-LIF (AAV packaging ratio) | ||
| Functional viral titer | Plaque-forming assay | ECIS - impedance | |
| Fluorescence foci assay | |||
| TCID50 (end point dilution assay) | |||
| Purity | Process impurities (detergents, resin) | MS | LC-MS |
| Chromatography | |||
| TEM | |||
| Host cell-related impurities | Host cell DNA/RNA: Picogreen, DNA Threshold assay, qPCR | ||
| Host cell proteins: SDS-PAGE, ELISA, HPLC, TEM | LC-MS, LC-MS/MS | ||
| Capsid content (empty: full capsids) | ELISA/qPCR | ||
| HPLC | CE-LIF, cIEF (isoelectric focus) | ||
| MS | LC-MS | ||
| TEM | |||
| AUC | |||
| Safety | Sterility | Standard sterility tests (EP 2.6.1, USP71) | Rapid microbial methods (RMM) |
| Endotoxin | LAL method (EP 2.6.14, USP85) Rabbit pyrogen assay | Recombinant Factor C (rFC) | |
| Mycoplasma | Cell-based assays | qPCR | |
| Replication competent virus (rep/cap sequences) | Southern blotting qPCR | ||
| Adventitious agents | In vivo and in vitro cellular assays | ||
| Stability | pH | Potentiometry | |
| Osmolality | Osmometry | ||
| Aggregate formation | Light microscopy | ||
| DLS | MADLS | ||
| SEC-MALLS | TRPS | ||
| TEM | |||
| AUC | |||
| FFF-MALS |
Table 1. Examples of current and next generation analytical assays used to assess viral vector CQAs.
Identity
Genetic Identity. Molecular methods, such as PCR, and genome sequencing (high throughput NGS), are utilized to confirm the identity of the vector genome.
Protein Identity. Comprehensive characterization of the capsid proteins is critical for viral infectivity and vector potency; therefore, serotype identity, capsid protein stoichiometry and integrity, contribute not only to expanding product knowledge but also ensures product and process consistency.6,7 The AAV serotype can be determined using enzyme-linked immunosorbent assay (ELISA), Western blot (immunoblot) or mass spectrometry (MS) methods. Both chromatographic and electrophoretic-separation techniques coupled to MS like LC (liquid chromatography)-MS and CE (capillary electrophoresis)-MS are used for peptide mapping, where LC-MS is most commonly used. Because CE-MS separates peptide moieties differently than LC-MS, it serves as a valuable orthogonal and complementary technique to provide a more complete analysis of capsid proteins.8
Sodium dodecyl sulphate-polyacrylamide gel electrophoresis (SDS-PAGE) is a commonly used, well-characterized assay to confirm viral vector stoichiometry (packaging ratios), but it suffers from poor resolution and assay variability. Capillary electrophoresis-sodium dodecyl sulphate (CE-SDS), which is a routinely used and well-established tool for mAb quality control, is a more precise method compared to SDS-PAGE, incorporating automation, improved resolution, reproducibility, and throughput capabilities and is a more appropriate instrument-based replacement that is increasingly being implemented in viral vector analytical workflows.9
Novel methods, such as AAV-ID, where differential thermostability is used to distinguish AAV serotypes and HILIC-FLR-MS method, which employs hydrophilic interaction chromatography (HILIC), followed by both fluorescence (FLR) and MS detection are promising technologies for protein characterization that will need further analysis and validation to determine their utility in QC workflows.7,10
Strength/Potency
According to the FDA 21 CFR 210.3(b)(16) guidance, strength is defined as:
- The concentration of the drug substance (for example, weight/weight, weight/volume, or unit dose/volume basis), and/or
- The potency, that is, the therapeutic activity of the drug product as indicated by appropriate laboratory tests or by adequately developed and controlled clinical data (expressed, for example, in terms of units by reference to a standard).
For biopharmaceuticals, potency is often regarded as equivalent to strength defined as “the specific ability or capacity of the product, as indicated by appropriate laboratory tests or by adequately controlled clinical data obtained through the administration of the product in the manner intended, to effect a given result.”11 Potency assays should be validated during the product development process. Whenever possible, a potency assay should measure the biological activity of the expressed gene product, not merely its presence.
Physical Titer. Physical titer is a measurement of intact virus bulk – how much is present in a given preparation, and is expressed as the number of viral particles per mL (VP/mL), or for AAV as genome copies per mL (GC/mL).
There are a variety of methods used to determine the physical titer of virus based on quantifying the concentration of viral genomes or viral proteins including ELISA, optical density assays (A260/280) and more sophisticated visualization systems like the NanoSight device (Malvern Instruments Ltd.) for viral particle quantification. High-performance liquid chromatography (HPLC) allows for the visualization and quantitation of intact virus particles in a heterogeneous preparation that also contains cellular and process contaminants.
By far the most routinely used method for physical titer measurement is real-time PCR-based assays because they are robust, easy, fast, and convenient. In the industry, there is a shift now from quantitative PCR (qPCR) to digital droplet PCR (ddPCR) to measure this attribute. With ddPCR, the sample is partitioned into thousands of individual micro-reactions that are quantified as either PCR-positive and PCR-negative at the endpoint of Taq polymerase amplification. This enables direct and absolute quantification of target DNA offering greater sensitivity in detection and less variability than qPCR, which requires comparison to a standard curve. ddPCR generates more precise and reproducible data especially in the presence of sample contaminants that can partially inhibit Taq polymerase and/or primer annealing.12,13 This makes it useful not only for final product characterization but for in-process analytics where the vector preparations are more heterogeneous.
Infectious or Functional Titer. Functional titer, or infectious titer, is a measure of infectivity – how many of the virus particles can actually infect a target cell. Infectious or functional titer is almost always lower than physical titer by a factor of 10 to 100-fold because not all of the virus product produced is functional/infectious. The infectious titer of a viral vector stock can also be altered by freeze-thaw of the viral solution, therefore monitoring the strength/potency during stability testing is pertinent.
Infectious titers are typically quantified by in vitro cell transduction assays such as the viral plaque (for cytopathic viruses), endpoint dilution (TCID50), immunofluorescence foci (IFA).14 For those vectors that express fluorescent transgenes, FACS can be used to quantify functional titer. While still considered the “gold standard” for determining functional titers, the cell-based assays are time-consuming and can have high variability. For example, some AAV serotypes do not transduce well in vitro and can, therefore, result in an underestimate of infectious titer.
The electric cell-substrate impedance sensing (ECIS) or real-time cell analysis (RTCA) method used to study cell growth and migration has shown utility in determining virus infectious titer, particularly in vaccine development. This label-free method is based on measuring the real-time changes in the electrical impedance of a circuit formed in a tissue culture dish plated with cells that are infected with virus.15,16 Biosensors monitor changes in host cell morphology, and cell-substrate attachment that occur as part of the virus cytopathic effect. As cells are infected with virus, they become more permissive to electrical current passage, which is measured as a decrease in impedance over time. The assay greatly improves time-to-result as well as being a more robust and rapid real time quantification of virus infectivity over traditional cellular assays.
Purity
Viral vector purity demands are high and will only increase as gene therapies become more established and are developed for more common indications and larger patient populations. Impurities from both the upstream and downstream operations as well as from the production cell lines can be introduced into vector preparations and must be carefully monitored and quantified since they can have unintended immunogenic effects.
Process Impurities. Examples of upstream impurities include cell culture media components and additives whereas detergents, residual chromatography resin, and other chemicals can be introduced through downstream purification processes. Typically, downstream clarification removes the large impurities but <1000nm molecules are still present in trace amounts, therefore, regulatory bodies require their quantification, which is typically achieved using MS and HPLC methods.
Production Impurities. Included in this category are unwanted host cell proteins (HCP) and nucleic acids from both the production cell lines as well as from any helper viruses and plasmids required to produce the therapeutic vectors. Host cell DNA/RNA can be detected using assays like PicoGreen, DNA Threshold assay and qPCR.
Classical HCP detection using ELISA provides an estimation of total HCP amount but the results are variable and can be influenced by buffer compositions and more. The main challenges for HCP analytics are the measurement of low concentration HCPs and the reproducibility of the assays. Therefore, health authorities are also requesting methods like CE, CE-MS, LC-MS and LC-MS/MS as orthogonal methods to ELISA for HCP characterization.17 These methods can also provide rapid analysis of capsid protein ratio, capsid protein structure and transgene length to facilitate rapid decision-making during process development and for in-process testing.18
In addition, impurities related to the viral vector product itself are of particular concern for viral vector developers and thus separate characterization of capsid content is a major focus.
Capsid Content. As emphasized by industry experts, capsid content characterization is a challenge and an area that requires the most development in terms of analytics. During the production of viral vectors, there will be a population of viral particles produced that fails to package the vector DNA properly. Vector-related impurities include:
- Empty capsids
- Capsids that contain nucleic acid sequences other than the desired vector genome
- Illegitimate, non-vector DNA (from transfection plasmids, host cells, or helper viruses)
- Truncated vector genomes
- Replication competent virus
One challenge in characterizing this attribute is that there is little change in size and shape of the capsid between empty, full, and partially full capsid particles. It is estimated that encapsidated DNA impurities may exceed 10% of vector genome-containing AAV particles in crude harvests.19 Because they closely resemble the actual vector product, separating vector-related impurities from legitimate vectors in downstream purification can be difficult (for empty capsids) to almost impossible (for some encapsidated DNA impurities). These unwanted vector-related impurities represent a population of heterogeneous, potentially immunogenic material in the clinical vector product that can impact patient safety and thus necessitates increased scrutiny.
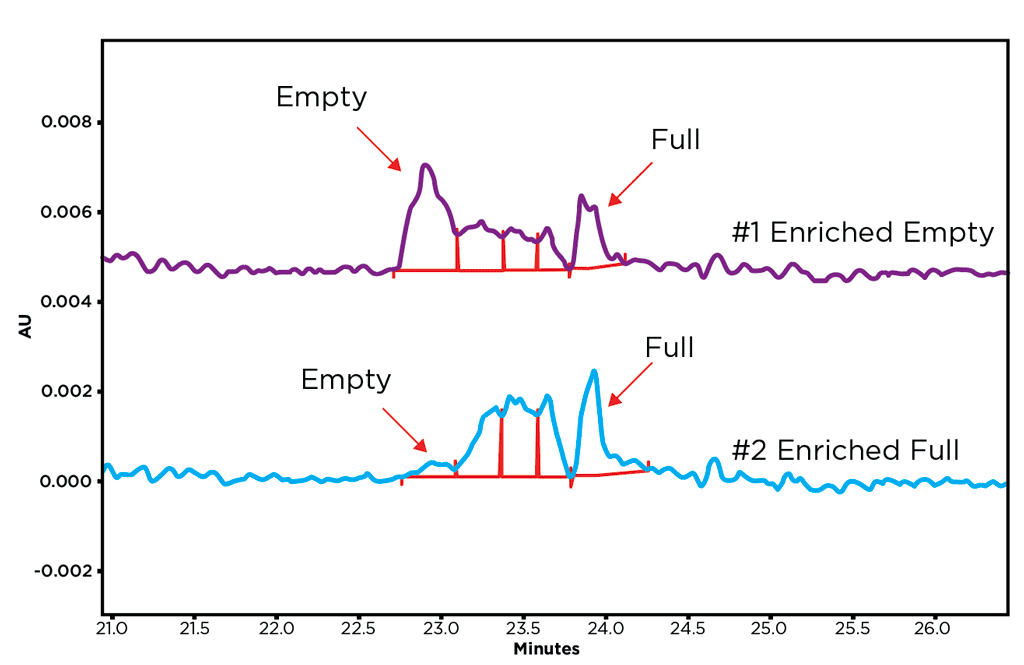
A commonly used tactic to determine the percentage of the full capsids in a vector preparation is to divide the number of genome vectors obtained from qPCR data by the total capsid number obtained from ELISA or optical density (A260/280) data.20,21 Other approaches including MS, HPLC, transmission electron microscopy (TEM), size exclusion chromatography (SEC) and analytical ultracentrifugation (AUC). However, many of these methodologies are unable to resolve partially full capsids, which drive a need for a technique with higher resolution capabilities.13,22 SCIEX has developed a capillary isoelectric focusing (cIEF) method using the PA 800 Plus Pharmaceutical Analysis System, which utilizes the different isoelectric points (pI) to resolve full, empty and partial capsids to determine their ratios in a vector preparation (Figure 2). The sample analysis time is less than 1 hour per sample, and is able to produce reliable, reproducible, high-resolution results across multiple AAV serotypes.23 Capsid ratios calculated using cIEF were comparable to orthogonal methods HPLC and AUC. The SCIEX platform is routinely used for QC of other biologics, making it an easy transition to viral vector manufacturing workflows.
Safety
Compendial safety testing of viral vector products includes sterility (USP 71), endotoxin and mycoplasma testing, as well as detection of any replication-competent viruses, and other adventitious agents.
Sterility. The standard two-week testing period is a challenge to reconcile with the timely release of viral vectors necessary for cell-based gene therapies, such as CAR T, with manufacturing pipelines that often have a narrow window for clinical application. The FDA and other regulatory bodies (EMA, PMDA, and ICH) have acknowledged this changing landscape by allowing the use of alternate, rapid microbiological methods (RMMs) for these new technologies (Table 2) through amendments to the 21 CFR 610.12 regulations in 2012 and the US Pharmacopeial Convention is developing a new chapter for rapid sterility testing.24
| Assay | Method | Instrument | LOD (cfu/mL) | Duration |
|---|---|---|---|---|
| ATP Bioluminescence | Luciferase assay: measures the ATP output of different microorganisms | Biotrace 2000 Pallcheck Rapid System Milliflex Rapid System Celsis RapiScan BioMAYTECTOR | 103 | 30 mins |
| Flow Cytometry | Detection of fluorescently labeled viable microbial cells after an initial 24–48 hrs enrichment step | Bact-Flow FACSMicroCount | 10-100 | 6-8 hrs |
| Isothermal Micro-calorimetry | Measures the thermal output resulting from microbial metabolism. | TAM III Calorimeter Biocal 2000 Isothermal Calorimeter 48-challen isothermal microcalorimeter | 104 | 2-7 days |
| Nucleic Acid Amplification | RT-PCR amplification of cellular RNA using universal primers; can be used with or without growth-based enrichment phase. | Multiple thermocyclers and amplicor analyzers | 10-1000 | 2-4 hrs |
| Respiration | Instrumentation such as respirometers, gaseous headspace analyzers and automated blood culture systems can be used to detect and enumerate respiring microorganisms. | Promex Microrespirator 4200 BACTEC System BioLumix BacT/ALERT System eBDS Pall System TDLS | 1-10 | Overnight – 7 days |
| Solid Phase Cytometry | Combines fluorescent labeling and solid-phase laser scanning cytometry to rapidly enumerate viable microorganisms in filterable liquids. | ScanRDI® System BioSafe PTS MuScan System | 1-10 | 2-3 hrs |
Table 2. Summary the six proposed analytical platforms as alternatives to traditional assays for compendial rapid sterility testing (adapted from Bonnevay, 2017).
RMMs are an increasingly common alternative to the manual test and while none of these methods will be universally applicable to all products, they can help significantly reduce testing and product release time as well as having a higher sensitivity, throughput and digital data output.24
Mycoplasma. Conventionally, mycoplasma contamination is detected by culture and cell indicator methods, which are time-consuming – a minimum of 28 days to complete. Rapid real-time PCR-based testing systems can provide results in a much shorter time-frame, suitable for in-process testing as part of a quality by design (QbD) approach for process development workflows.
Endotoxin. The USP currently recognizes two endotoxin tests, the Rabbit Pyrogen Test and the Limulus Amebocyte Lysate (LAL) Test. The Recombinant Factor C (rFC) test is available as an alternative method and is currently under evaluation by the USP.25
Replication Competent Virus(RCV). Viral vectors are engineered to be replication defective, therefore the risk of generating replication-competent virus is low. While the incidence is low, these events can occur during any stage of vector manufacturing by means of recombination events within the production cells and can increase with each successive amplification. Therefore, RCV testing is mandated by regulatory bodies to ensure the biosafety of the final product. Cell lines permissive to retro-, lenti- or AAV infection are used to test for RCV in vitro. Southern blotting or qPCR are also used to detect presence/amplification of rep or cap sequences.
Stability
Stability studies are conducted during all phases of drug development typically starting at the preclinical stage of drug development and continue through Phase I–Phase III clinical trials to support formulation development, and to satisfy the regulatory requirements for clinical trials. In general, the shelf-life specifications should be derived from the QC release criteria, with additional emphasis on the stability-indicating features of tests used and tests/limits for degradation products. Vector integrity, biological potency (including transduction capacities) and strength are critical product attributes which should always be included in stability studies. A common problem is a tendency for viral vector aggregation and particle formation upon extended storage after filling that can affect its functionality. Techniques such as AUC, size exclusion chromatography with multi-angle laser light scattering (SEC-MALLS), TEM/Cryo-TEM and dynamic light scattering (DLS) to study aggregation states of viral products as part of stability testing.14
Multi-Angle Dynamic Light Scattering (MADLS) is an advancement to DLS that is becoming increasingly employed for aggregate detection. Whereas DLS measurements occur at a single fixed detection angle, MADLS measures the sample at three angles. This combinatorial data results in less noise, improved resolution and improved size accuracy for particle distribution analysis.26
Tunable Resistive Pulse Sensing (TRPS) is another high throughput platform that could facilitate more accurate measurements of viral vector aggregation. Particle size measurement is based on impedance as they pass through a nanopore, to generate an accurate size distribution output (relative to a known calibration standard) comparable to TEM results.27
Looking Forward: Knowledge Gaps to Address
The consensus amongst our experts that viral vector manufacturing is essentially where monoclonal antibody development was 20 years ago. While the uptake of PAT has been slow, it is definitely gaining momentum with stakeholders heavily invested in driving analytical tool development forward. Certainly, we can use the knowledge gained through the antibody bioproduction scale-up process as a roadmap for how to proceed with viral vectors. The ability to leverage applicable technologies can be advantageous to streamline process development time.
Having real-time or near real-time analytical assays to monitor key attributes like titer, capsid content, and aggregation is needed to support PAT. These rapid analytical tools will allow for in-process monitoring that, when combined with predictive analytics, can provide real-time feedback controls to decrease in-process development cycle times for product quality improvements. Ultimately these methods can increase the speed to market for a new therapeutic. This can also be immensely helpful in making decisions about the forward progress of a viral vector batch if a particular attribute is out of specification. The in-process data can determine whether or not to continue a batch run, which can help to minimize batch failures and decrease the cost of goods.
Predictive analytics brings together data mining (current and historical data) and machine learning to generate predictive models about what will happen during manufacturing processes. As well, the incorporation of automation with traditional analytical tools, such as automated Western blots and ELISAs, produces digital outputs that allow automatic tracking and processing of data. This automation not only decreases labor costs, but also enables faster iterations during in-process development. Management of the automated bioprocess, data collection and analysis by commercially available computerized platforms has the potential to advance the speed of process development and optimization by providing real-time feedback control. This is more suited to continuous, scalable manufacturing workflows. Taken together, these next generation analytical tools can facilitate the creation of a flexible, efficient, and cost-effective development supporting flexible and streamlined manufacturing process allowing therapeutics to reach the market faster to meet patient needs.