Continuous suspension cell culture monitoring in bioreactors using quantitative phase imaging
Cell culture monitoring for cell count and cell viability typically involves manual sampling from each bioreactor followed by Trypan-blue cell exclusion. This sampling needs to happen at least once per day and ideally more often. An operator must then enter the results into a spreadsheet or other tracking software and generate a growth curve. The challenge with this process is that it is highly manual, and time consuming. Sampling an entire facility means a whole team is required to monitor what can be upwards of 50+ bioreactors. In addition, manual sampling creates an opportunity for contamination and variability.
Continuous Cell Culture Monitoring
A recent poster titled, “Continuous suspension cell culture monitoring in bioreactors using quantitative phase imaging,” describes an alternative cell culture monitoring method that enables continuous monitoring of cells while in culture. The poster highlights a study designed to demonstrate the effectiveness of continuous cell culture monitoring and to measure how results compare with established reference methods.
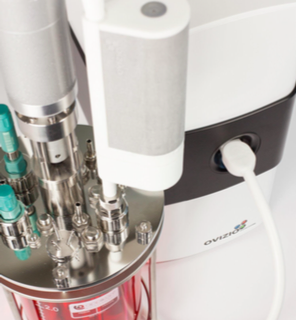
The continuous monitoring system utilizes the iLine F microscope. The iLine F employs an innovative quantitative imaging technique called quantitative phase imaging (QPI) that enables cell counting and cell viability monitoring in a label-free, continuous operation. This allows the iLine F to monitor cell growth inside the bioreactor on a single cell level, thus permitting the tracking of cells, how they are performing against established parameters and continuous documentation of the process.
Materials used in the study include the iLINE F microscope and coordinating OSOne Acquisition and Analysis software both developed by Ovizio. Also, included is the BioConnect autoclavable and disposable closed-loop bioreactor interface, and a reusable pump engine with automated flushing. For the culture, CHO cells inoculated at 0.3×10⁶ viable cells/mL in CD-OptiCHOTM medium (Life Technologies), were cultured in a 3L glass bioreactor using batch culture for 12 days.
Study Results
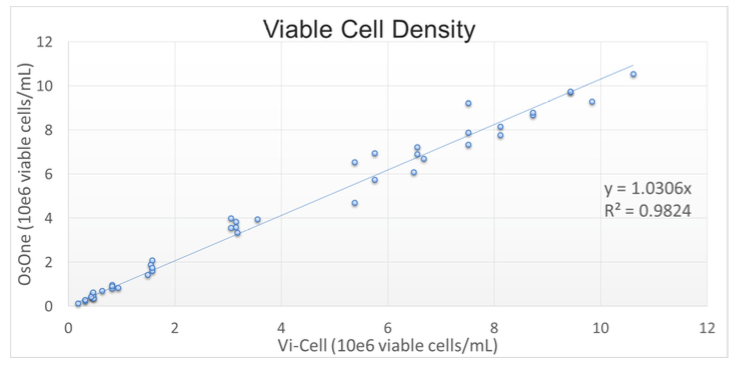
Results generated by the iLine F were compared with a reference method: the Vi-Cell XR off-line counter (Beckman Coulter), automated Trypan-Blue staining. A correlation factor R2 of 0.982 was obtained on the Viable Cell Density, demonstrating that the results obtained with QPI are in line with current reference methods (Figure 1).
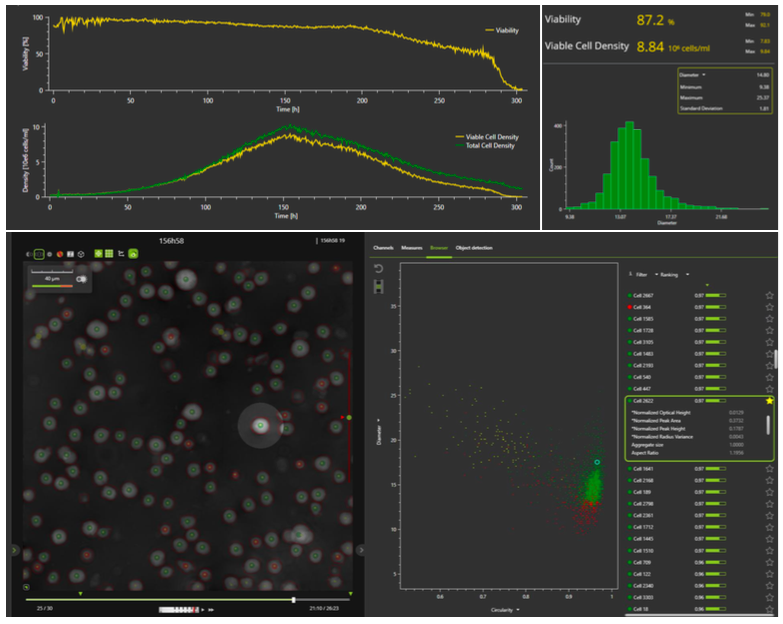
The iLine F microscope and coordinating OSOne Acquisition and Analysis software allows tracking of total cell density and viability in real-time. The specialized software plots the cell growth curve and shows real time images of the cells, providing the additional benefit of visual inspection. In addition to cell density and viability, a total of 70 parameters are recorded. Real-time images of the cells offer operators a unique peek inside the bioreactor to see how cells are performing without disturbing the culture. An example of the OSOne software interface can be seen in Figure 2.
Advantages of QPI highlighted in the poster include:
- Full traceability at single cell level
- Continuous monitoring
- User independent, improving reproducibility
- No sampling, no staining
- No toxic waste
- Ready for automation
- Increased insight in your culture process
- Adds aggregates information as aggregates are not disrupted during sample preparation
- More than just cell density and viability: up to 70 parameters are recorded
Interview with author Jérémie Barbau
After reading the poster, I was fortunate to be able to interview the author Jérémie Barbau, Application scientist, Ovizio. I asked about quantitative phase imaging, continuous cell culture monitoring, and other applications for this technology. Here is the summary of our interview:
Question: What do you see as the biggest advantage of implementing a continuous cell culture monitoring system?
To me, the biggest advantage of implementing a continuous cell culture monitoring system is that it frees up time for the lab scientists to perform other, more valuable tasks, than taking and analyzing cell culture samples. They could use this time to perform more in depth analysis of the data provided by the iLine F, or prepare more complex experiments. I also see as a strong advantage that the persons following the culture are not “in the dark” between 2 samples. I mean, sometimes samples are taken only every 24h. Many things can go wrong in 24h and a lot of relevant events in the culture can be missed. In the case of the iLine F, a cell count and a viability assessment can be performed every 30 minutes, thus allowing the user to follow closely the culture and detect a potential deviation earlier.
Question: How much training and adjustment is required to move from off-line sampling to continuous monitoring using the iLine F?
Using the iLine F is pretty simple. All you need is a 12mm port available on your vessel. By the way, there are also other methods to attach our probe (the BioConnect) on a vessel. Welding, sterile connectors, you name it! One adjustment that might be required is the creation a specific counting algorithm. This is required only if your cells are quirky. With regular cells, such as CHO, there is no training of the algorithm needed. Basically, the move from offline to continuous sampling is easily made as the results of the offline counting are in line with what you would expect from an offline counter such as the ViCell.
Question: Can you describe how this type of continuous monitoring can enable a PAT approach?
Process Analytical Technology is a strategy that allows the user to design, analyze and control the process of manufacturing. It required a lot of data in order to identify and define boundaries for your Critical Process Parameters. With the use of OsOne, the user can gather up to 70 parameters on every single cell. It represents a huge amount of data that can be used to identify which of these 70 parameters can be considered as Critical Process Parameters, which have a relevant impact on the product quality. Usually, parameters such as circularity or diameter can be used but in the case of the iLine F, other, more specific, parameters can be used. I am thinking about the roughness of the surface of the cells for instance. Anyway, once the major Critical Process Parameters are identified, boundaries can be set. Meaning that these parameters can vary in a defined space in which you know that there will be no impact on the product quality. If one of the Critical Process Parameter gets out of the define space, the user can be warned. What is nice again, is that you get one measurement every 30 minutes, so minor deviations can be corrected before they develop into serious issues.
Question: In the poster you describe how the iLINE F can be used to identify and count blood cells. Are there any other applications for the technology, particularly in the Cell Therapy space?
Indeed, Cell Therapy is a market we can easily address as every cell type has a specific signature, a specific fingerprint if you will. So the system is able to quantify the proportion of each cell type, estimate viability, and help the lab scientist to decide when it is the right moment to harvest the cells to have them in the best condition.
Question: Do you have plans for new features or future expansions of this technology?
Currently, we are working on devices that are making use of the same technology, but for different type of cultures. We have a device that allows to turn any “regular” microscope into a holographic microscope. We also have a device that can see through different layers of a multi-layered vessel, such as a Cell Factory. All these devices are capturing 70 parameters, per cell, even when the cell is attached to a support. Future work would include decreasing the footprint of the devices and work towards full automation. Another track we are working on is the integration of other sensors such as pH and Dissolved Oxygen into our probe.
New features are arising as customers are approaching us with new challenges. Recently we were able to help a customer with the real-time measurement of the viral load in the cell culture. OsOne was able to determine the proportion of cells that were infected and follow it accurately all along the infection process.
For more details of the study and to view the poster, please see: