
Cool Tool – Stunner quantifies RNA and lipid nanoparticle size distribution for RNA vaccines
An analytics game changer for RNA-LNP vaccine and gene therapy development and manufacturing
The development and manufacture of mRNA lipid nanoparticle (LNP) vaccines in record time is a testament to the incredible potential of emerging therapeutics in medicine today. Not only is this technology delivering on the herculean task of subduing a raging pandemic, but it is also being explored in vaccines for other infectious diseases and as treatments for cancer, multiple sclerosis, cystic fibrosis and others.
As we look toward scaling and streamlining the production of RNA-LNP vaccines, it is important to evaluate how to improve the overall process. RNA-LNP therapeutics are complex to develop and accurate analytics are a key part of development and final release. Two key analytical techniques with room for improvement are RNA concentration and size distribution of lipid nanoparticles (LNP), which are the quality and efficacy of RNA-LNP vaccines.
Challenges with classic analytical methods for RNA-LNP vaccines
As is the case with most new emerging therapeutics, there is an emphasis on proof of concept and speed to the clinic. Once a therapeutic has reached a level of success, focus turns to how these products can be manufactured more cost effectively, at greater scale, and at higher quality. A critical component of these evaluations is analytical data.
For RNA-LNP vaccines, LNP particle size is critical to mounting an effective immune response, so dynamic light scattering (DLS) has long been used as a key analytical technique. The challenge is that many DLS instruments can only measure one sample at a time, taking minutes per read. This low level of throughput limits the speed of development and doesn’t provide a complete picture because multiple samples can’t be readily compared and gathering enough data for descriptive statistics takes too much time.
RNA concentration is also an important analytical metric and dye-based fluorescence assays are traditionally used to determine RNA concentration in RNA-LNPs. However, the detergents that are used in this process to destabilize LNPs can interfere with assay accuracy and precision. By contrast, UV/Vis absorbance can work well for RNA quantification in purified samples, but LNP samples have high turbidity, making for cloudy solutions that prevent most UV/Vis spectrophotometers from getting accurate readings.
Stunner – A fit for purpose solution
The shortcomings of classic analytical methods leave an unmet need for an analytical tool that can easily deliver size and concentration information with high-throughput to keep up with challenging timelines. To address these needs Unchained Labs launched its new RNA-LNP application on Stunner in January. Stunner solves the challenges of classic analytical methods by pairing high-throughput DLS with intelligent, short pathlength UV/Vis to quantify LNP size and total RNA concentration even on cloudy RNA-LNP samples. It is the first platform to provide researchers with a full read-out on RNA-LNP size, size distribution, total RNA concentration and turbidity in about a minute using only 2 µL of sample.
Data that’s a perfect fit – How it works
RNA concentration
As mentioned, LNPs are notoriously cloudy so their UV/Vis absorbance spectra are dominated by light scattering across the ultraviolet and visible range, making it difficult or impossible to determine RNA concentration using most UV/Vis spectrometers.
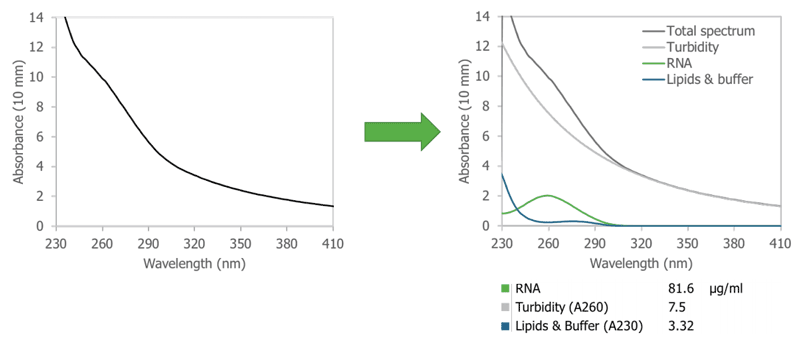
In contrast, Stunner utilizes dual sub-millimeter pathlengths to provide precise measurements and a broad dynamic range. The short pathlengths are needed to allow sufficient light to pass through the sample for successful absorbance measurements. Stunner’s proprietary Unmix algorithms are then used to isolate the impact of turbidity and determine the individual contributions of turbidity, RNA and other sample components to this overall signal (Figure 1). Stunner quantifies the total RNA concentration in the sample and reports the contribution of turbidity and other components to the overall absorbance spectrum.
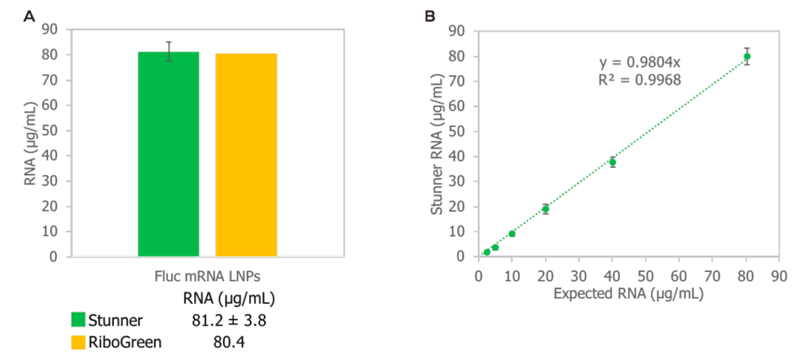
Stunner’s RNA quantification methods for LNPs has been favorably compared to the RiboGreen® assay for total RNA concentration (Figure 2A), with a workflow on Stunner that is dilution-free, standard-free, surfactant-free, and dye-free. Across a wide dynamic range, Stunner quantifies RNA-LNP concentrations with high precision. A 2-fold dilution series of Fluc-RNA-LNPs showed a high degree of linearity and agreement with the expected RNA concentration with R2 > 0.99 and a slope close to 1 (Figure 2B).
Particle size
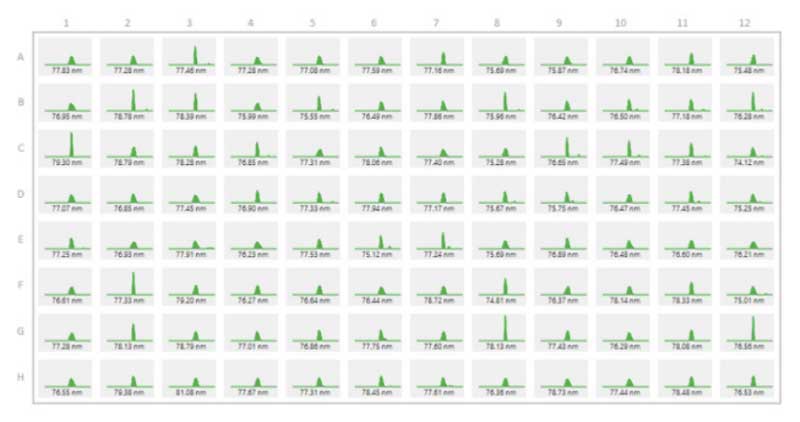
Particle size is another critical metric for LNPs. Classic methods use DLS to verify particle size, but most instruments require high sample volumes or are low throughput with only one sample able to run at a time. This makes it difficult and time consuming to screen large numbers of formulations. Stunner solves this by performing DLS measurements on up to 96 samples in less than 1 hour. Results can be shown in an overview so average size and size distributions can be quickly compared by eye (Figure 3). These results can also be exported to Excel for further analysis or saved as a PDF report, simplifying otherwise complex experiment workflows and data management.
Turbidity assessment
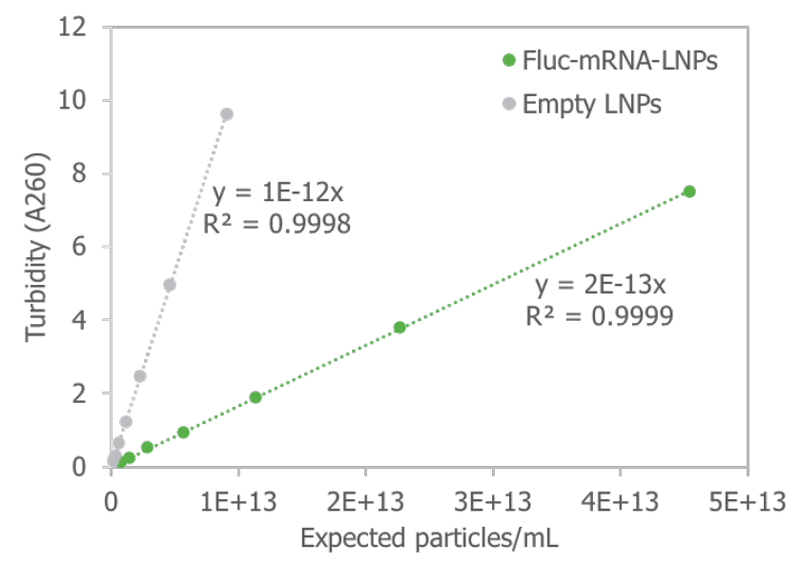
Another tool that the Stunner provides is a measurement of turbidity. Stunner’s UV/Vis assessment of turbidity can be used to inform users on what is going on with their particle. Turbidity of a colloidal system is determined by the size, the payload, and the number of particles in the suspension, correlating linearly to the expected particle concentration of empty and full LNPs (Figure 4). With well-defined standards, it may be possible to use Stunner’s turbidity determination as a method of determining particle concentration in LNP suspensions.
Additional features
To further increase throughput, Stunner is automation-friendly with SBS format plates and full-featured API. For regulatory environments, Stunner can be equipped with 21 CFR Part 11 tools and UV/Vis performance can be verified within the US and European Pharmacopeia requirements. For everyday use, Stunner’s UV/Vis performance can be proven with The Fundamentals – a set of certified tryptophan standards demonstrating Stunner’s accuracy, precision, and linearity across a wide range of OD values.
Summary
Stunner provides a fit for purpose solution for the everyday analysis of RNA-LNP during vaccine and gene therapy development. Stunner solves the challenges of current methods by delivering results with high throughput, low sample volume, and a simple, one-step workflow to offer an easy-to-use solution to accelerating RNA-LNP development.
For more information, please see: