
Deciphering Continued Process Verification and Automating the Process for Straightforward Implementation
Continued process verification (CPV) is used by biopharmaceutical companies to ensure that the manufacturing process for a therapeutic remains in a continual state of control during the lifecycle of the product. This is to make certain that the final drug product’s strength, quality and purity is maintained for the product’s duration on the market. Both the Food and Drug Administration (FDA) and the European Medicines Agency (EMA) have directed manufacturers to develop a CPV program to collect and analyze product and process data to evaluate the state of their manufacturing controls and to identify any product or process problems. It also provides the opportunity to evaluate and implement process improvements.
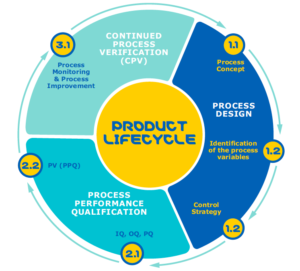
A product’s lifecycle normally consists of 3 phases: process design, process performance qualification, and the last and lengthiest, continued process verification (CPV), which carries on throughout the lifespan of the product (Figure 1.)
For some time, biomanufacturing groups have been focused on developing programs to analyze and monitor process design and process performance, but continued process verification has been more difficult to address. The reasons are likely due to the complexity of this type of monitoring, the long term, ongoing nature of the monitoring, and to a lack of the right tools to implement these kinds of programs. However, recently the FDA and EMA have issued guidance on instituting ongoing programs to collect and analyze product and process data, and have been issuing warning letters to non-compliant companies. As a result, the industry has placed a more urgent need on establishing comprehensive CPV programs.
The sheer amount of process and analytical data per manufacturing batch is very high and thus requires a structured procedure for collecting and analyzing. Manually collecting data and trending it statistically is extremely time-consuming and prone to errors, making it a poor option for implementing CPV. Since a structured CPV program is now a regulatory expectation for process manufacturing and quality operations, the industry needs an automated software solution built specifically for ongoing process verification.
Bio4C™ ProcessPad
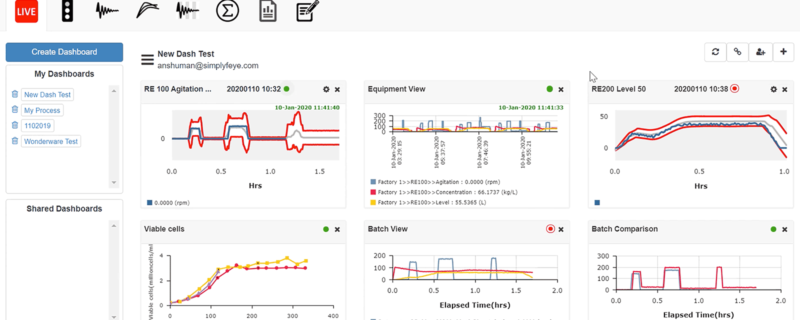
To address the need for an automated solution, MilliporeSigma launched Bio4C™ ProcessPad – a data visualization, analytics, and process monitoring platform that enables bioprocess lifecycle management, reporting, investigations, and continued process verification. It allows biopharmaceutical scientists to collect and manage data from paper-based records, spreadsheets, batch record data, quality control data, external databases, data historians, and streaming machine data in a single software environment. Bio4C™ ProcessPad provides data visualizations and analytical tools for straight forward statistical trending of data control charts, correlation charts, box plots, etc. It also offers easy reporting including campaign reports, process summary reports, Annual Product Reviews (APRs) and Annual Product Quality Review (APQR). Along with offline monitoring of data, the Bio4C™ ProcessPad-RT collects, aggregates, and provides direct web-browser access to real-time streaming data from processing equipment such as bioreactors, chromatography systems, buffer systems, etc.
I recently read a very comprehensive white paper by MilliporeSigma, “Implementing Continued Process Verification with Bio4C™ ProcessPad,” that provided an in-depth guide on the required components of a CPV strategy and also how the use of an automated software system can aid in establishing a compliant and efficient CPV program.
Highlights from the White Paper
Process validation is an important part of all stages of a product’s lifecycle, from process design through commercial production. The product lifecycle can be divided into three stages.
- Process Design: The commercial manufacturing process is defined during this stage based on knowledge gained through development and scale-up activities.
- Process Qualification: During this stage, the process design is evaluated to determine if the process is capable of reproducible commercial manufacturing.
- Continued Process Verification: Ongoing assurance is gained during routine production that the process remains in a state of control.
Unlike process validation’s first two stages, which have a distinct endpoint, CPV is sustained for the life of a drug molecule and requires a comprehensive strategy. In the white paper, MilliporeSigma identifies five key components required to establish a CPV program and explains in detail how to implement each step:
- Parameter classification and statistical treatment of data
- Determining process capability (Cpk) and process performance (Ppk)
- Parameter monitoring
- Out-of-trend detection rules
- Documentation and reporting.
Parameter classification and statistical treatment of data
Parameter classification is defined by process characterization, process validation or in-process control description documents and sets initial action or specification limits. These parameters are broken into three categories:
- Critical Process Parameters (CPP) – A performance or input parameter that directly impacts product identity, purity, quality, or safety. Requires routine monitoring.
- Key Process Parameters (KPP) – A performance or input parameter that directly impacts CPPs or is used to measure the consistency of the process step. Requires routine monitoring.
- Monitored Parameters (MP) – A performance or input parameter that may or may not impact KPPs and is used to measure the consistency of the process step or routinely trended for troubleshooting purposes. Routine monitoring is set on a case-by-case basis.
Limits are then defined and applied to each parameter type. The limits that need to be considered during process monitoring include: specification limits, action limits, alert limits or statistical control limits and targets. Specification limits and action limits are defined during process design and qualification and the first 15 to 30 batches can be trended against these limits. Alert limits (or statistical control limits) should then be defined based on these historical/initial 15 to 30 batches.
Once the parameter criticality for the desired product quality is determined and parameters classified accordingly, the next step is to perform statistical treatments on the data to determine statistical control limits for the desired performance parameter. The white paper provides a detailed explanation of how these steps are conducted and how to set up the control limits for CPV.
Determining process capability (Cpk) and process performance (Ppk)
Process capability indices provide a quantitative way to determine the performance and future capability of the process within the desired quality boundary for the given manufacturing environment. Process capability indices have been used in manufacturing to provide quantitative measures on process potential and performance. The output of a process can be a product characteristic or a process output parameter. Process capability indices (Cp, Cpk,) provide a common metric to evaluate and predict the performance of processes and summarize process performance relative to a set of specifications, that is, quality boundaries.
Parameter Monitoring
During process monitoring, a performance parameter under the monitoring program will undergo different monitoring modes (or phases) depending upon the number of data points and accumulated history of the parameter being monitored. The white paper defines the different monitoring phases including:
- Preliminary Process Monitoring Phase – primarily a data collection or accumulation phase for obtaining enough historical information to make reasonable assumptions on inherent variability (common cause variation) of the parameter and estimate a statistical control limit with reasonable confidence. The PPM phase should run for a minimum of 15 data points. During this phase no statistical control limits will be applied to any parameter types.
- Statistical Process Control Phase – once the basic history of a parameter (capturing common cause variability) is accumulated, control limits will be established using statistical methods and procedures described in earlier sections. All parameter data received after the PPM phase will be trended against these newly established control limits.
- Resetting or Revising Control Limits – control limits should be periodically re-evaluated, revised or reset as appropriate based on batch history and process changes.
Out-of-trend Detection Rules
The white paper provides a detailed description of Nelson rules, which should be established and used for out-of-trend detection. This provides a method to determine if some process parameters are out of control. Definitions for the first four Nelson rules that can be used to trend parameters and detect out-of-control batches are provided. Once detected, a rule violation investigation should be conducted and closed with appropriate corrective and preventative actions.
Documentation and Reporting
Routine monitoring status should be periodically presented to key process stakeholders within the organization and reports published to document the process knowledge obtained. In the white paper, three types of reporting are described in detail, which I have summarized here:
- In-process Control and Monitoring (IPCM) Document – an IPCM document should be prepared for each commercial process for each manufacturing location. It should list all performance process parameters (CPP, KPP and MP) that will be routinely monitored and process limits.
- Periodic Presentation of Process Trends – all monitored parameters should be routinely trended on a weekly basis for each commercial process with respect to each processing location with key findings (alerts, etc.) from routine monitoring presented to key stakeholders at a regular frequency.
- Quarterly Process Summary Reports – process summary reports should be published every quarter for each commercial process per manufacturing location.
Bio4C™ ProcessPad CPV Platform
While the implementation of CPV can be very daunting, Bio4C™ ProcessPad provides a comprehensive solutions to help organizations implement CPV in an automated and straightforward manner. It was designed to automate the data visualization, analytics and process monitoring required for CPV management, reporting, and investigations. It stores the batch processing and analytical testing data in a validated state so that the data can be easily available for process troubleshooting and process benchmarking operations. It also aids organizations in their compliance efforts by meeting all the applicable requirements of 21 CFR Part 11.
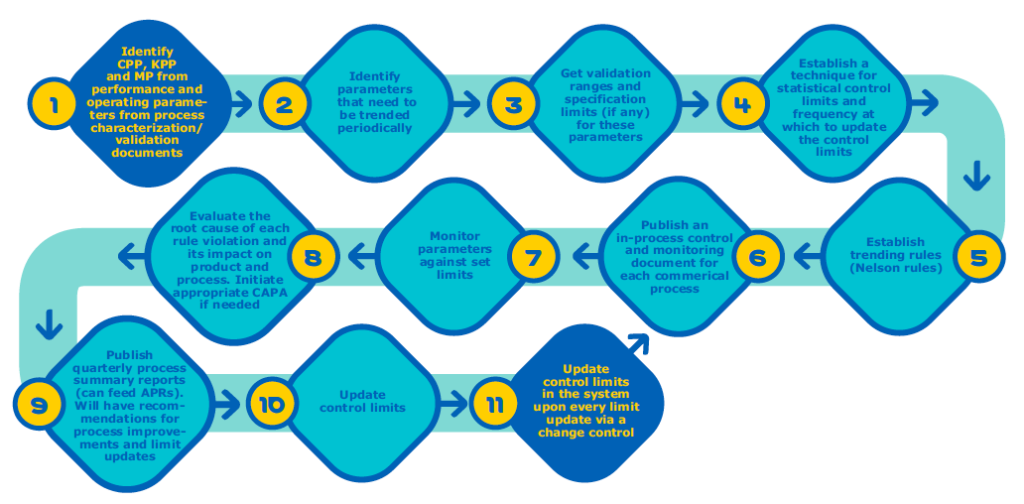
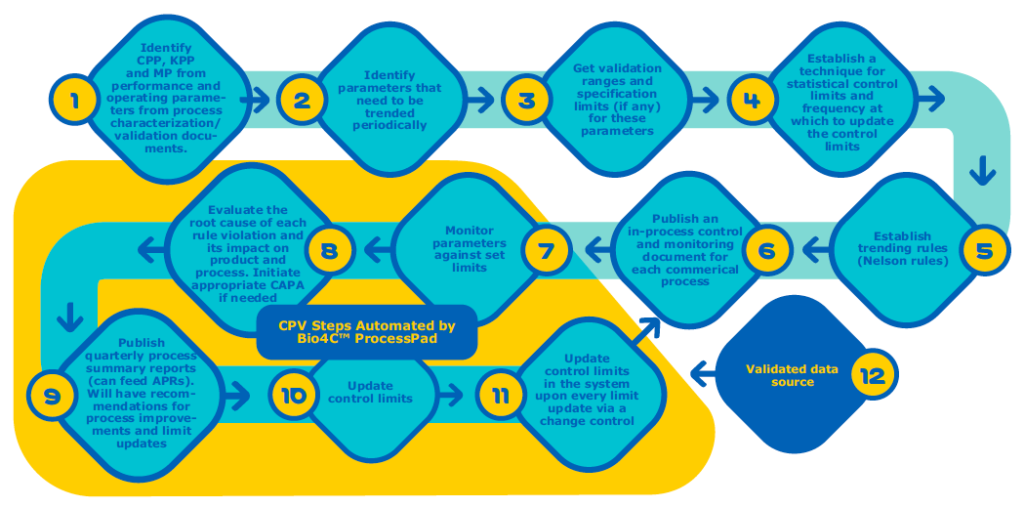
When comparing Figure 2 and Figure 3 you can see the CPV steps that can be automated using Bio4C™ ProcessPad.
Key Features of Bio4C™ ProcessPad
Validated Data Source
Bio4C™ ProcessPad is a validated data source. All the data entered in Bio4C™ ProcessPad goes through two layers of verification to ensure that data entered is accurate and reliable and has stringent access level control. Bio4C™ ProcessPad also has audit trail which captures every action performed by all users.
Plug-and-Play Monitoring
Bio4C™ ProcessPad was designed specifically for process monitoring. Thus, it can conduct many key monitoring operations out of the box.
Report Generation
As discussed, CPV reporting is a required, albeit tedious task. It involves collection of data from all the batches executed in a specified time frame and trending them with statistical control limits, calculation of process capabilities (Cpk and Ppk) and citing the statistical trend rule violation.
Bio4C™ ProcessPad provides standardized campaign CPV reports with report templates prepared by selecting the desired parameters from all the process stages into a trending template. This template can then be scheduled for automatic periodic report generation.
Key Advantages of Bio4C™ ProcessPad Compared to Traditional Software
There are numerous software options that claim to do CPV reporting, but it is important to consider whether they are fit for purpose and if they encompass all the necessary operations required of CPV. Because Bio4C™ ProcessPad was designed specifically for biopharmaceutical manufacturing CPV, it provides several advantages:
- The ability to validate archived data
- Data capture and storage mechanisms
- Out-of-the-box, trend analysis with trend violation detection using Nelson or Western Electric rules
- Upstream and downstream data process monitoring
- Golden tunnel dashboards for machine data enables live process monitoring in historical context
- Only truly browser based software for CPV to enable collaboration, scale and performance
- Simple, easy to use interface with minimal training requirements
- Deployable within weeks
- Designed to be accessible for all users, not just data scientists
Please visit, Bio4C™ ProcessPad to learn more or read the full white paper, Implementing Continued Process Verification with Bio4C™ ProcessPad.