Optimizing Characterization and Quantification of Therapeutic Oligonucleotides
Oligonucleotides (OGN) are a class of therapeutics comprised of short strings of synthetic nucleotides. OGNs have the ability to to alter, suppress or restore expression of target genes associated with disease or health. This makes them uniquely positioned to provide treatment for diseases with a known genetic component. There are currently more than 80 companies currently investigating OGNs to treat diseases and it is a therapeutic modality that is growing dramatically.
The first OGN therapy, Vitravene also known as Fomivirsen, was approved in 1998. Since then, the application of OGNs has continued to evolve and several additional approvals have followed. As is the case with most emerging therapies, there are manufacturing challenges, in particular characterizing and quantifying OGNs can be difficult. I recently watched a webinar given by Sean McCarthy, PhD, Global Technical Marketing Manager, SCIEX that provided a thorough explanation of the current analytical challenges with OGNs and also tools and techniques to improve their characterization and quantitation.
Dr. McCarthy started the webinar by providing a background on OGNs and reviewed current analytical challenges including: negative ion mode, the use of ion paring agents, adduct ion formation, wide charge state distribution, fragment efficiency dependent on charge state selected, and sample preparation recovery.
He then discussed the instruments that SCIEX offers for OGN analysis. He began with their mass spectrometry platform consisting of the QTRAP® 6500+ LC-MS/MS system, the TripleTOF® 6600+ LC-MS/MS system and the X500B QTOF. All of the instruments perform very well in negative ion mode, which is required for OGN analysis. He then discussed their separation tools including options for both high flow and microflow. For microflow, the Microflow M5 Micro LC provides efficient separation and very good sensitivity. Sean then talked about coupling the OptiFlow™ interface on the front end of the instruments, which allows them to achieve very good sensitivity in a microflow process without the challenges of setting up a microflow instrument. The OptiFlow® ion source requires no changes or adjustments to achieve optimal performance. Last, SCIEX has high quality quantitative software as well as a partnership with Novatia around using ProMass software for quantitative work and characterization.
OGN Characterization
Sean then explained what LC-MS can provide for characterization:
- Mass confirmation of target sequence
- MS/MS confirmation of sequence– required to ensure that the order of the nucleo bases are in order that were expected during synthesis and that the reagents used for synthesis were placed in the correct location.
- Purity assessment
- Failure sequence identification
Specific components available to aid in the characterization include: the IonDriveTM system technology and Turbo V™ ion source that provide efficient desolvation of the molecule. This is important if using high or moderate concentrations of ion pairing reagents to achieve separation chromatographically. The QJet® ion guide transfers ions into the mass analyzer while reducing the contamination on the front end. It provides efficient removal of the ion pairing reagents and is robust even with complex matrices.
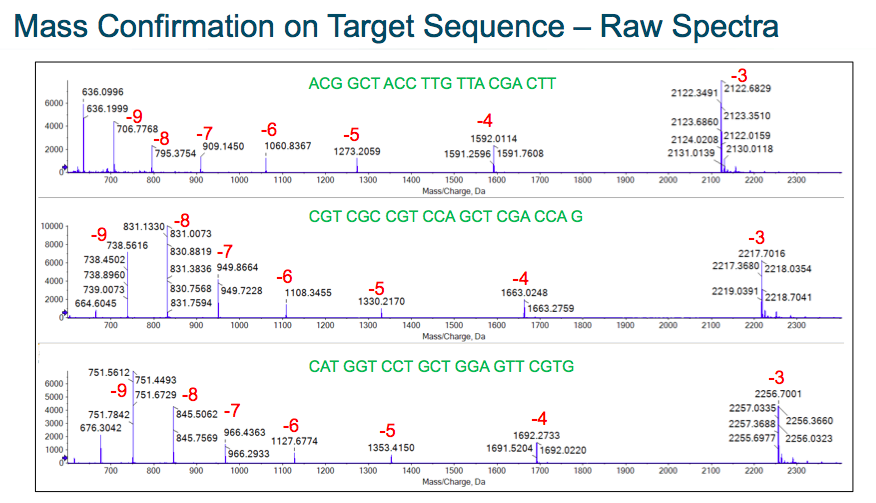
Next Sean walked through specific characterization data examples. He demonstrated mass confirmation of the target sequence at both the MS and MS/MS levels. The data showed consistent performance and the different charge states that are present. The data also showed robust signals for the different species that were present (Figure 1).
Next he demonstrated examples of the high quality MS/MS data for sequencing of OGN therapeutics. In the data, you can see robust fragment ion data across the entire OGN with representative fragments from two different ion series (Figure 2).
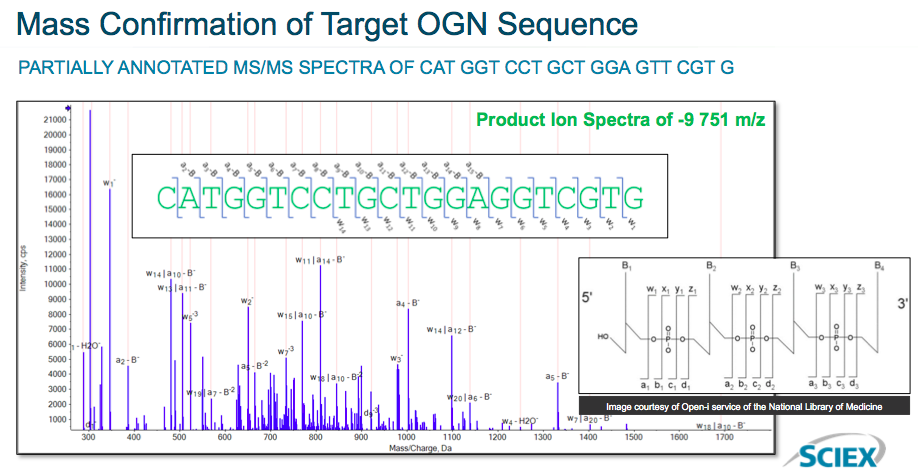
Additional data was presented which looked at the ion data in more detail.
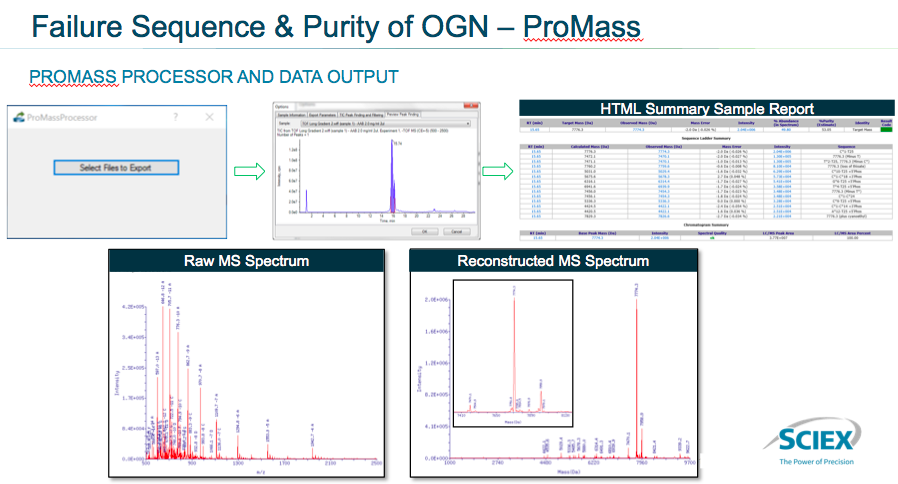
Sean then presented data showing LC-MS failure sequence identification and identification of the impurities using the ProMass integration. He presented an overview of the interface (Figure 3). In the interface you can see the opportunity to import files to consider in ProMass, then choose the integration parameters and select the specific data for ProMass to process. This raw data is then automatically processed by ProMass software and an HTML summary report is generated, which includes the raw MS data and reconstructed MS data.
Quantitation of OGN by Mass Spec
Sean began this discussion by discussing the advantages and limitations of using LC-MS. Advantages include: high selectivity, wide linear dynamic range and the ability to do multiplexing. Limitations include: low sensitivity compared to traditional binding assays and high reagent cost. There was a clear need to improve sensitivity using LC-MS.
To do this, the team at SCIEX looked at overall sensitivity improvement as a function of the flow rate of the analytical method in front of LC-MS (Figure 4). They found that there wasn’t much of a change in sensitivity when moving between the 10 and 200 μL/minute flow rate. However, there was a significant increase in sensitivity when moving to the microflow range of 1-10 μL /minute and another increase at the nanoflow range of 100-1000 nL/minute.
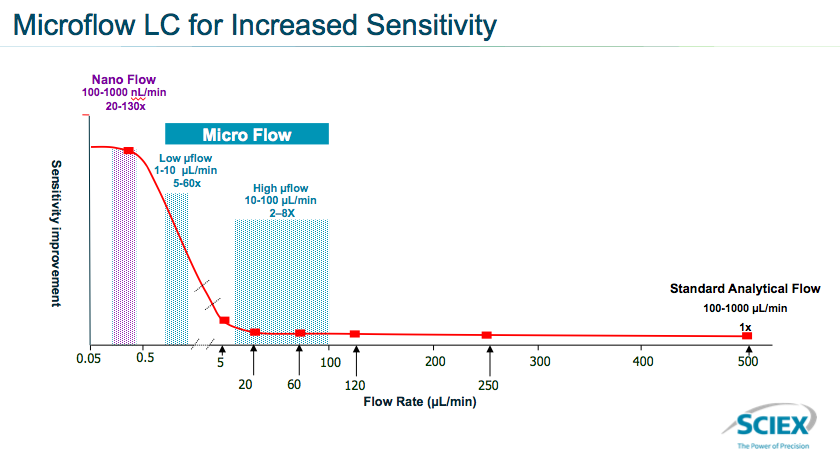
The team focused on optimizing microflow because it provided a good balance between increase in sensitivity while still offering a good flow rate.
For this work they used the M5 MicroLC with the OptiFlow® ion source. The OptiFlow® ion source provides a plug and play solution with minimal column and electrode fittings on source and minimized dispersion. In addition, no source optimization is needed, as source geometries are all pre-optimized. The OptiFlow® ion source also has excellent flow spray stability, which means good reproducibility and run-to-run performance.
Next Sean presented a case study of Fomivirsen quantification using microflow LC/MS.
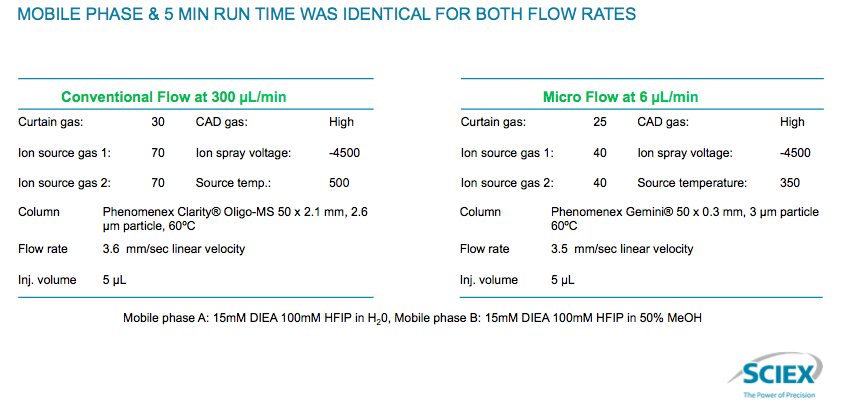
It is an antisense OGN 21-mer with full phosphorothioate linkages. The initial work was a comparison of high flow at 300 μL /min vs. microflow at 6 μL /min. What they found was that the parameters were virtually identical (Figure 5).
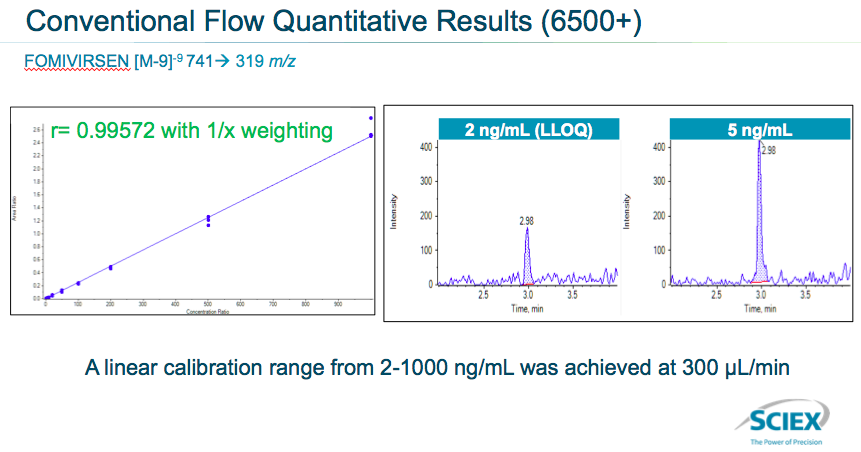
Next they looked at quantitative results between the two flow rates. For conventional flow they saw a linear calibration range from 2 – 1,000 ng/ml was achieved at 300 μL /min (Figure 6).
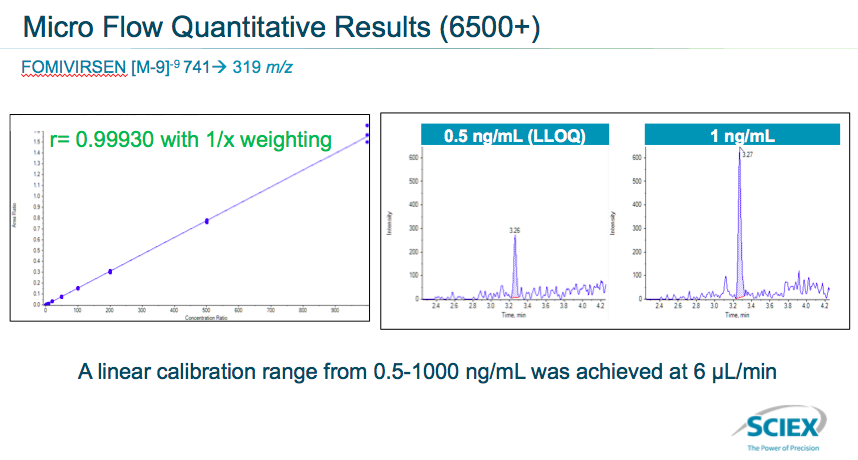
For microflow, a linear calibration range from .05-1,000 ng/mL was achieved at 6 μL /min. They achieved really good signal to noise (Figure 7).
Next they compared the sensitivity of the two flow rates. Using microflow they were able to achieve a signal to noise ration improvement of 10x (Figure 8).
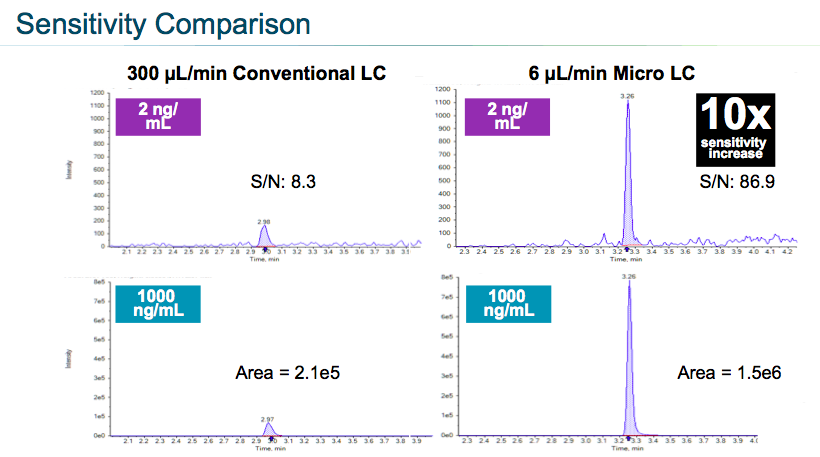
Key takeaways from the study were that microflow reduced the flow rate 50 fold. The introduction of ion pairing reagents was also reduced 50x with μLC/MS, thus significantly decreasing the potential for contamination. They were able to quantify OGN therapeutics down to pg/ml levels (500 pg/mL). Lastly, they achieved significant sensitivity improvement (5-10 fold) when compared to high flow LC-MS and achieved a 3.5 order of magnitude for linear dynamic range.
To learn more about this experiment please see the webinar: Characterization and Quantification of Therapeutic Oligonucleotides