
Scaling Strategy for Moving mAb Process from Microscale to Production Scale Bioreactors
The most efficient process optimization requires successful scale-up and scale-down of manufacturing processes. Scaling strategies are key to ensuring that the scaled-down process will scale-up as expected and that the scaled-down process is a true representation of larger scale manufacturing. A strategic scaling approach is important to determine the bioreactor operating parameters to be kept constant during scaling. While critically important, a good scaling strategy is not a simple task and I am pleased to share the following guest blog that walks through creating a scaling strategy for moving from microscale bioreactors to production bioreactors. I was fortunate to be able to interview the author about his article and have provided the transcript of our conversation following the guest blog.
Scaling a mAb production process to Xcellerex bioreactors
A Guest Blog by Dr Andreas Castan, Principal Scientist, GE Healthcare
Moving a monoclonal antibody production process from a microscale bioreactor to the Xcellerex XDR single-use platform
The transfer of a monoclonal antibody production process between scales, often referred to as scale-up or scale-down, is a difficult task. Multiple scaling criteria exist to accomplish the necessary modifications, and intensive knowledge of physical characterization parameters for the bioreactors is required.
In this study, we have leveraged existing physical characterization data and scaled a process from microbioreactor scale to production scale in an Xcellerex XDR-1000 bioreactor. We show the physical operating parameters and present both cell culture and product quality data across all scales. The presented data sets demonstrate the scalability from microbioreactors to Xcellerex single-use bioreactors and across the XDR platform.
Determining bioreactor design and scale for monoclonal antibody production processes
Why are good scaling strategies important? In scaling up, a strategic approach helps to find bioreactor operating parameters for the larger scale the process is being transferred to. In scaling down, it is important to find and develop a small-scale bioreactor and process that can run in a pilot or production scale bioreactor, while accounting for limitations in mass transfer.
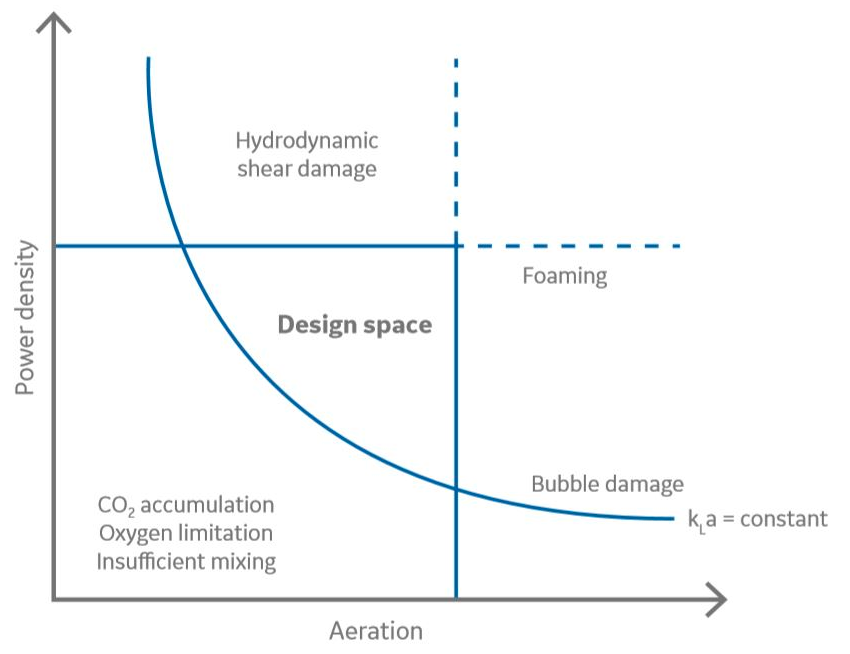
Bioreactor operating parameters, such as gas flow rates and agitation speed, are bound by upper and lower limits. Operating below the lower limits for oxygen flow restricts oxygen transfer. Running above the upper limits for agitation and aeration might create high shear or excessive foaming, respectively. When scaling a process, it is important to stay within the same design space across scales (Fig 1). The design space for the large size reactors will be smaller than for smaller reactors due to mass transfer limitations on the large scale. The design space is illustrating a feasible range for power density (P/V) and aeration. In that range, sufficient oxygen transfer and mixing are achieved without introducing excessive foaming, adversely high carbon dioxide concentration, and impeller shear or bubble damage.
Multiple bioreactor scale-up parameters can be chosen to be kept constant during scaling, such as the power density, mixing time, volumetric oxygen transfer coefficient (kLA), tip speed, shear rate, or volumetric gas flow rates. The large number of relevant scaling parameters makes the effort to define the optimal design space multidimensional.
Physical characterization data form the basis for scaling. We have performed physical characterization of the single-use XDR platform from the 10 L scale up to 1000 L (1–5). Data for kLa, mixing time, heating and cooling capacity, and power input were measured over a wide range of agitation speeds, gas flow rates, and working volumes.
The Xcellerex single-use stirred-tank bioreactor platform is available from 10 L up to 2000 L (6). The 10 L scale is a flexible system suitable for process development, small-scale production, and process troubleshooting. The larger sizes provide scalable and robust stirred-tank performance in both cGMP and non-cGMP environments. The platform supports batch, fed-batch, and perfusion processes.
The ambr™ 15 microreactor cell culture system was chosen because it is a well-known bioreactor system used in industry. The system is an automated bioreactor with 24 to 48 parallel cultivations in a 10 to 15 mL format. It is preferably used for example media and feed screening, early process optimization, and design of experiments (DoE) studies.
In this study, we applied the developed scaling strategy to find suitable operating parameters from microbioreactors to XDR-1000 and cultured the same mAb-producing cell line in various scales with these sets of parameters. As a result, we could demonstrate comparable process performance, product quality, and scalability across a range of bioreactors from lab- to industrial-scale.
Materials and methods used to scale the mAb production process
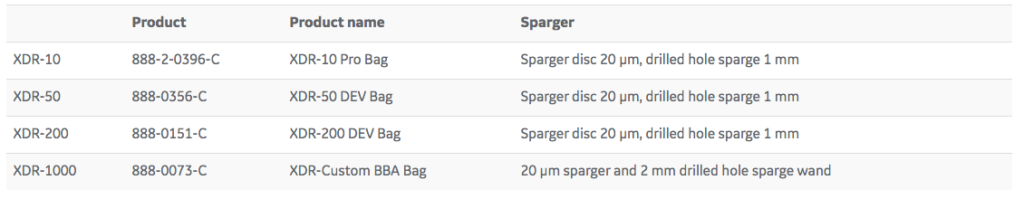
An in-house Chinese hamster ovary (CHO) mAb-producing cell line was cultured in HyClone ActiPro cell culture medium. A fed batch process was run in multiple scales: ambr 15, XDR-10, XDR-50, XDR-200, and XDR-1000. The disposable bags that were used can be found in Table 1. Starting at day 3, the reactor was fed with Cell Boost 7a and Cell Boost 7b once a day. The daily feed volumes, related to the initial working volume, for Cell Boost 7a and Cell Boost 7b were 3% and 0.3%, respectively. Addition of glucose was started at day 5 when glucose levels decreased below 2 g/L.
The general approach was to maintain constant agitation throughout the run based on power density. Dissolved oxygen (DO) was first controlled with increased air flow until a cap was reached. Pure oxygen was then added to maintain the target DO in the later part of the process. In the ambr 15, P/V and kLa values for the settings used were obtained from the operating manual. Due to the size of the ambr 15 small-scale bioreactor, its geometry and hydrodynamics are quite dissimilar to the XDR bioreactors. Consequently, a similar scaling strategy could not be employed.
Daily samples were taken from the reactor and analyzed. Viable cell density (VCD) and viability were measured using Vi-CELL™ XR. pH, pO2, pCO2, and osmolality were measured using a BioProfile FLEX™. Product titer, nutrients, and metabolites were all measured on a Cedex™ Bio Analyzer. Product quality was analyzed on samples taken on day 7 and at harvest (day 13). Product quality was assessed with respect to antibody charge, glycan profile, aggregate, and fragment proportion. Size exclusion chromatography (SEC) was used to analyze aggregate-main-fragment ratios. For charge variants, weak cation exchange chromatography (WCX) was used. Hydrophilic interaction chromatography (HILIC) was used for the N-glycosylation profile.
The results for the ambr 15 reactor are based on the average values from 12 replicates with associated standard deviation plotted (shown in error bars). All other data is based on one culture for each bioreactor size.
Scaling strategy
The scaling strategy consisted of three steps:
- Dial in the agitation based on keeping the power density constant
- Determine the gas regime to achieve constant oxygen transfer rates across scales
- Adjust the total gas flow to reach a constant vessel volume per minute (VVM) across scales
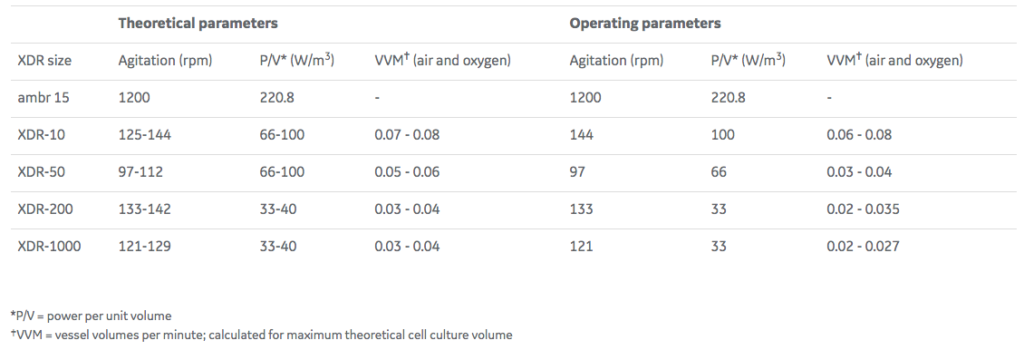
A theoretical scale-up study was performed based on physical characterization data generated from the XDR platform. The theoretical study formed the basis for the scalability study of a mAb process in the Xcellerex XDR cell culture systems. Agitation and gassing settings suitable for the cell line and the cultivation process were calculated and tested. This exercise also included sparger selection, gas management, and determination of the appropriate oxygen-to-air ratio for efficient carbon dioxide removal (Tables 1 and 2).
During scaling, it is important to consider all parameters affecting mass transfer together and target suitable operating parameters across all scales. As mentioned above, the practical operational window will not be the same for all scales. In Table 1, the theoretical values and the values used in this study are displayed.
Slight adjustments were made regarding the P/V criteria. It was not possible to reach the targeted kLa with the same power input across all scales. For this reason, the P/V had to be set to 100 for the XDR-10, 66 for XDR-50, and 33 for XDR-200 and XDR-1000 (Table 2).
Results and conclusions from the mAb production scaling study
In total, four cultivations runs were performed in the XDR-10, XDR-50, XDR-200, and XDR-1000 bioreactors. In addition, 12 replicates were performed in the ambr 15 microbioreactor.
In general, the operating parameters according to the scaling strategy (Table 2) were successfully applied and we observed comparable process performance with respect to cell growth, metabolites, titer, pCO2, and product quality.
Cell growth, cell concentration, and viability
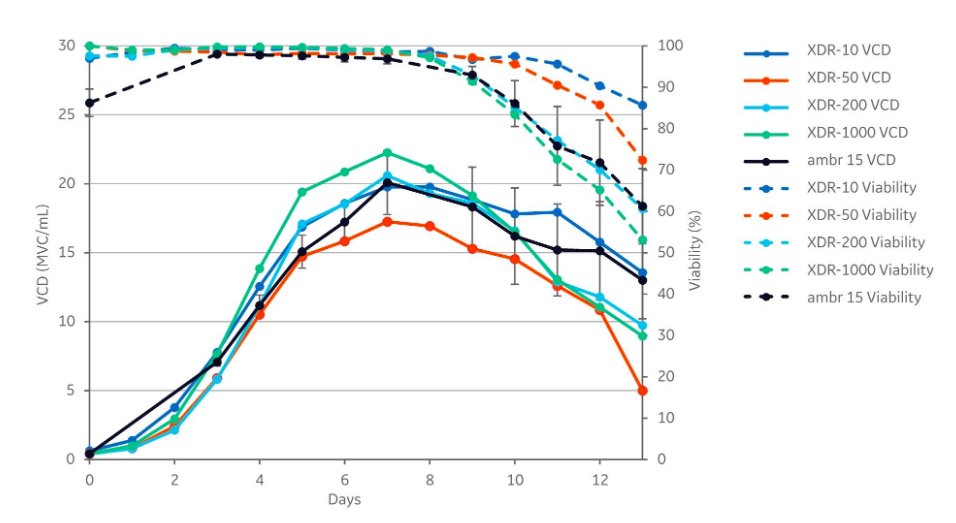
Each of the cultivations displayed similar growth patterns. The peak viable cell densities (VCD) varied between 17.3 and 22.3 viable cells/mL (MVC/mL), and the cell density peaked in all cultivations on day 7. The difference between the highest peak VCD (XDR-1000) and the lowest peak VCD (XDR-50) is approximately 5×10⁶ MVC/mL.
Lactate
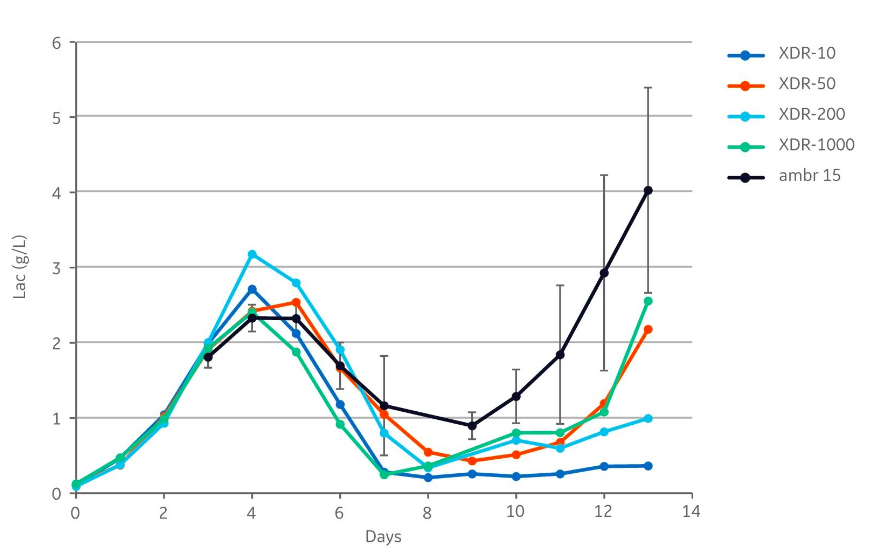
Similar lactate concentration profiles were observed in all cultivations (Fig 3). After the initial batch phase, the lactate concentration peaked at day 4 and lactate consumption was thereafter observed in all bioreactors. However, the lactate concentration increased from days 9 and 12 in the ambr 15, XDR-50, and XDR-1000 compared to the other reactors.
Productivity and monoclonal antibody product quality
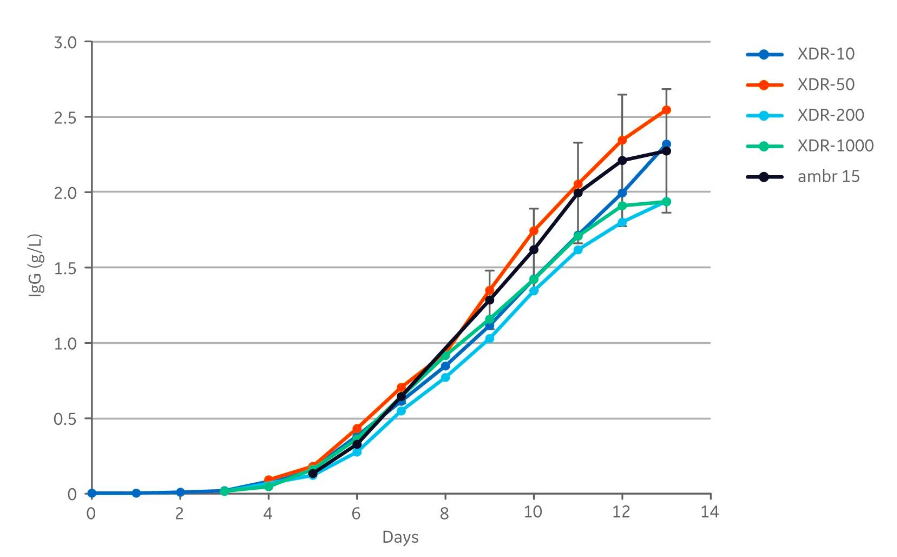
The product concentrations at harvest in the different cultivations were between 1.9 to 2.5 g/L (Fig 4). The harvest titers in all cultures were within the standard deviation ±0.41 g/L (calculated for the harvest day) from the 12 ambr 15 runs.
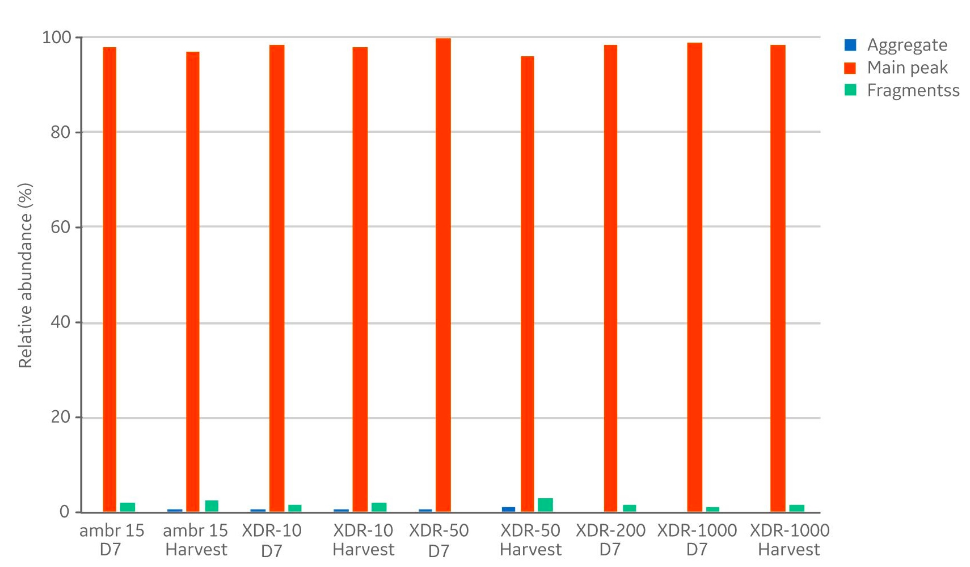
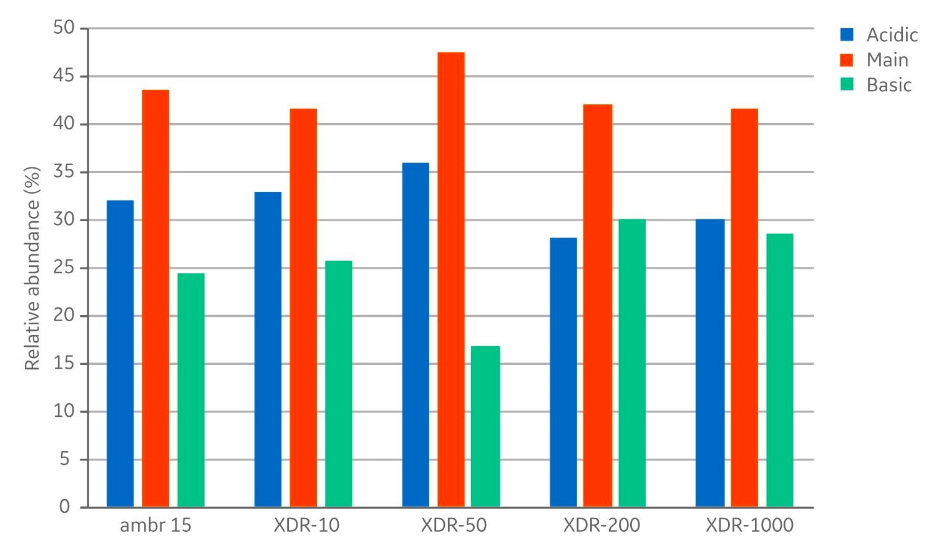
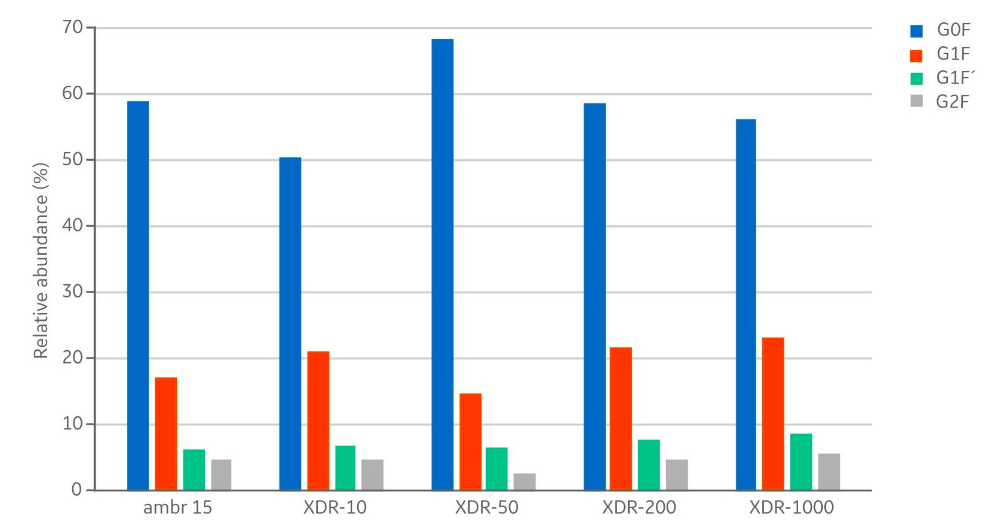
In addition to product concentrations, the product quality at harvest was assessed with respect to size, charge variant, and glycoform distribution. The size distribution (Fig 5) showed no differences with respect to aggregates (< 1% in all samples) and fragments (< 3% in all samples). The measured distribution of charge variants (Fig 6) showed no specific trends when comparing the different bioreactor scales. The N-glycosylation is the most important product quality attribute to ensure comparable final product quality. The analysis of N-glycans (Fig 7) showed good comparability between the cultivations in the investigated bioreactors. The four most abundant N-glycans shown here represent >90% of all glycoforms.
The similar product quality profile shown here is an important finding that demonstrates scalability across the range of investigated bioreactors.
In addition, the pCO2 was assessed. pCO2 was below 20 kPa in all bioreactor runs. The profiles were comparable for all XDR scales; however, due to limited working volumes in the ambr 15, pCO2 could not be measured.
In all the investigated bioreactor systems, VCD, viability profile, product titer, lactate, and product quality displayed similar trends over time and were within an acceptable range in terms of variability when comparing the cultures. This work demonstrates good scalability of the ambr 15 and XDR systems and establishes general agitation and gassing settings suitable for the mAb production process using CHO cells.
Interview with Dr Andreas Castan, Principal Scientist, GE Healthcare
Could you tell us what you see as the most challenging aspects of scaling a process?
When scaling, certain parameters are easy to keep constant during the scaling exercise. Example of these geometrically scaled parameters are tank diameter, impeller diameter, liquid height etc. Other parameters cannot be scaled at all and are constant across scales e.g. the size of the cells and the size of the gas bubbles. As a result, scaling cannot be performed linearly, but the scientist needs to navigate between different scaling criteria. Example for these criteria are energy dissipation rates, mass transfer coefficients, mixing time or shear regime. Many of these criteria are predictive for either small or large scale.
Navigating between these multiple scaling criteria to keep the process in the intended design space is therefore not easy and needs some considerations. Strategies to achieve good scalability are described in the presented application note.
What advice do you have for overcoming these challenges?
My advice would be to keep it simple. In my experience, two main boundary conditions need to be fulfilled: One is to support the oxygen need of the cell culture, i.e. meeting the oxygen transfer rate (OTR) or kLa requirement at a certain time point in the culture.
The second one is related to carbon dioxide stripping. As CO2 stripping is mainly driven by the volumetric gas flow rate (vvm), maintaining it constant across scales would be the second boundary conditions. The scientist needs now to find settings that deliver a sufficient OTR at a defined vvm.
In the study, you selected three steps as part of the scaling strategy. Why did you decide on those three steps?
The three steps describe a strategy to mitigate the difficulties outlined in the first question. When scaling, the scientist needs to operate in a multi-dimensional space of agitation rate, sparger configuration, gas flow rate and oxygen content of the gas stream. In the first step, the complexity is reduced by locking the agitation rate and then dialing in the gasing regime to match the OTR and vvm requirement.
Why was the product quality consistency an important finding in the study?
At the end of the day, the product quality is always the most important parameter as it characterizes the product delivered to patient. In addition, many other in-process controls like e.g. the VCD profile and the profile for key metabolites need to be matched, however, product quality is the most important. Therefore, maintaining a consistent product quality across scales is a proof scalability.
What do you see as the most important takeaway from the study?
The most important takeaway is, that it is straight forward to scale into the XDR platform from micro- or lab-scale bioreactors and to scale between XDR bioreactors. The basis for a successful scaling are physical process characterization data with respect to mixing, power input and gas transfer. During the presented scaling exercise, we demonstrated that consistent process performance and product quality were maintained. With that, good scalability of the XDRs was demonstrated.
Learn more about single-use bioreactors
Footnotes
-
1. Application note: Engineering characterization of the single-use Xcellerex XDR-50 stirred-tank bioreactor system, GE Healthcare, 29241667 Edition AA, (2017)
-
2. Application Note: Engineering characterization of the single-use Xcellerex XDR-200 stirred-tank bioreactor system, GE Healthcare, 29268546, Edition AA, (2017)
-
3. Application note: Engineering characterization of the single-use Xcellerex XDR-500 stirred-tank bioreactor system, GE Healthcare, KA4969250918AN (2018)
-
4. Application Note: Engineering characterization of the single-use Xcellerex XDR-1000 stirred-tank bioreactor system, GE Healthcare, 29242384 Edition AA, (2017)
-
5. Application note: Engineering characterization of the single-use Xcellerex XDR-2000 stirred-tank bioreactor system, 29243481 Edition AB, (2017)
-
6. Xcellerex XDR cell culture bioreactor systems, GE Healthcare, KA686051118DF, (2018)